
Figure 24.
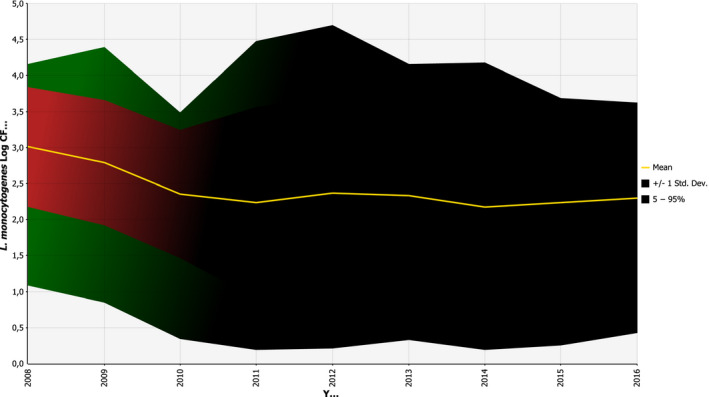
Summary trend graph for Listeria monocytogenes concentration in ‘fish and fish products’ reported in RASFF notifications for the years 2008–2016
Official websites use .gov
A
.gov website belongs to an official
government organization in the United States.
Secure .gov websites use HTTPS
A lock (
) or https:// means you've safely
connected to the .gov website. Share sensitive
information only on official, secure websites.
Summary trend graph for Listeria monocytogenes concentration in ‘fish and fish products’ reported in RASFF notifications for the years 2008–2016