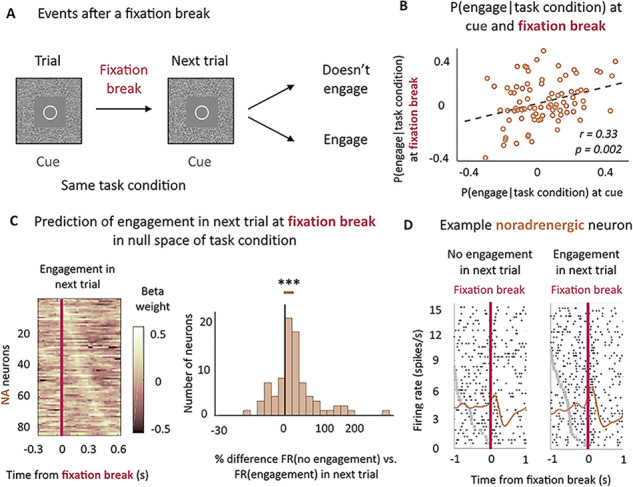
Figure 5.

Noradrenergic neurons’ activity predicts the engagement on the next trial. (A) Task structure after a fixation break. (B) Correlation between noradrenergic neurons’ sensitivity to the probability to engage for each task condition at the cue onset and the fixation break across sessions. Significant correlation (r = 0.33, P < 0.01). (C) Noradrenergic neurons’ activity at fixation break is predictive of engagement in the next trial above and beyond the task condition. Left: sliding window analysis of the sensitivity of the firing rate to engagement in the next trial in null space of task condition at cue. Linear regression in 200 ms windows with an increment of 25 ms. X-axis represents the center of the window. Y-axis corresponds to each neuron. Color code represents the value of the beta weight in the regression. Neurons are ordered (top to bottom) by latency of their peak. Right: % difference between the firing rate distribution for no engagement in next trial and engagement in next trial in the null space of task conditions (mixed effect linear regressions on non-z-scored distributions). The distribution is represented on a log-scale. Significant difference (P < 0.001). *** P ≤ 0.001. (D) Example noradrenergic neurons at fixation break for no engagement (left) and engagement (right) in the next trial. Neuronal activity (raster and spike density function) is displayed around fixation break (t = 0, pink vertical line). Trials are sorted by decreasing latency between cue onset (gray dots) and fixation break. Cue onset is only visible for bottom trials, with latencies shorter than the displayed 1 sec. As a majority of LC neurons, this one shows a stronger activation when monkeys engaged on the next trial (β = 0.17).
