
Figure 1.
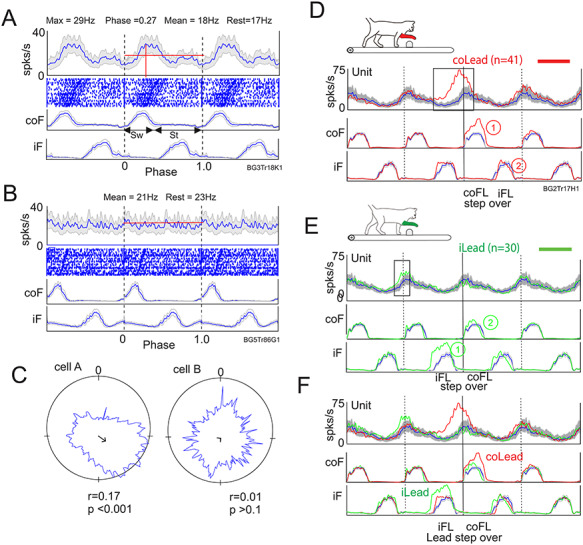
Quantification of cell activity. A, B, example of a modulated (A) and unmodulated (B) cell. For each cell we show a perievent histogram (PEH) of the averaged activity of the cell during unobstructed locomotion, together with a raster display of cell activity and the averaged activity of the contralateral and ipsilateral forelimb flexors (coF, iF). The activity during the cycle is repeated 3 times to emphasize the nature of the rhythmical activity. Data are synchronized to the onset of activity in the coF. The horizontal red line indicates the mean activity during the step cycle (mean), and the red vertical line indicates the maximum discharge frequency (max) and the phase of that activity (phase). Sw and St in A indicate the swing and stance phases, respectively, of the step cycle. Rest indicates the resting rate discharge frequency measured just before locomotion. C: the cell discharge is displayed in a circular format with the onset of the step cycle beginning at 0 and moving clockwise. The arrow gives an indication of the dispersion of the discharge (r) with the maximum value for a cell discharging always in the same place being 1. The value of p indicates the probability that the discharge is directional. D, E: Averaged unit and EMG activity from a different cell when the contralateral (D) or the ipsilateral (E) limb is the first to step over the obstacle. F: contralateral and ipsilateral lead superimposed. Activity in D–F is synchronized to the onset of activity in the coF. Blue traces indicate activity during unobstructed locomotion and the shaded gray area indicates the interval of confidence (P = 0.01) of the standard error (SE) of the mean. Red traces indicate activity when the contralateral limb is the first to step over the obstacle and green traces the activity when the ipsilateral limb leads. coFL and iFL beneath the displays in D, E indicate when the contralateral and ipsilateral limb, respectively passed over the obstacle. “Lead step over” in F indicates when the lead limb passed over the obstacle in the contralateral and ipsilateral lead condition. Rectangles on the cell trace in D, E indicate cell activity during the gait modification that is considered to be significantly different from that in unobstructed locomotion. Numbers within circles on D, E indicate the sequence of activation of the coF and iF.