
Figure 11.
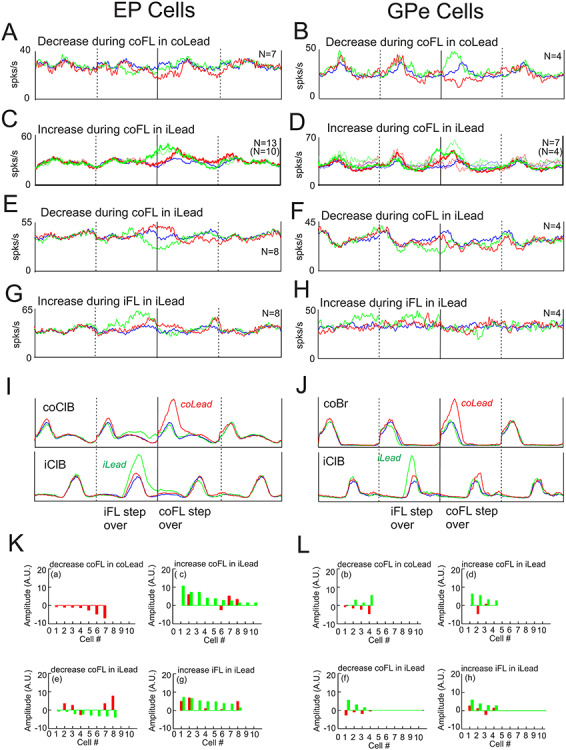
Additional step-related population averages. A–H: population averages created from cells that showed different patterns of activity. Convention as in Figure 10. I, J: Averaged EMG activity taken from the averages in A, B. K, L: magnitude of the responses of the changes in activity of the individual cells included in the population averages of A–H (indicated by a-h). Magnitudes are rank-ordered according to locomotor condition and are comparable with those in Figures 9 and 10.