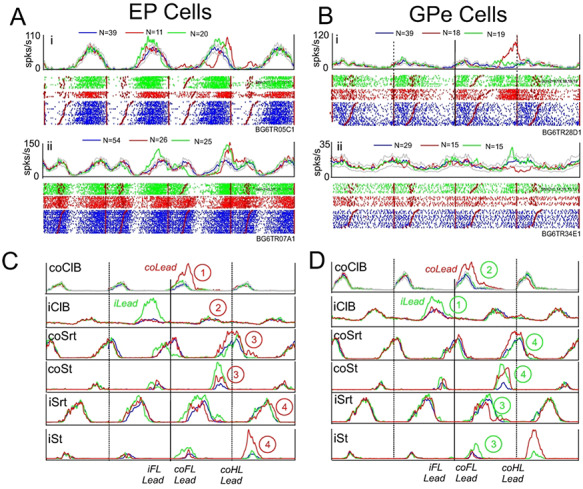
Figure 12.

Cells discharging in relation to the hindlimb. A, B: Examples of cells in the EP (A) and the GPe (B) showing their major change in activity during the step over the obstacle by the contralateral hindlimb. Data organized as in Figure 6, with data aligned on the onset of activity in the coClB/Br. Numbers within circles indicate the sequence of activation of the contralateral fore- and hindlimb muscles in the contralateral (illustrated in C) and ipsilateral (illustrated in D) lead conditions. Eding step.
