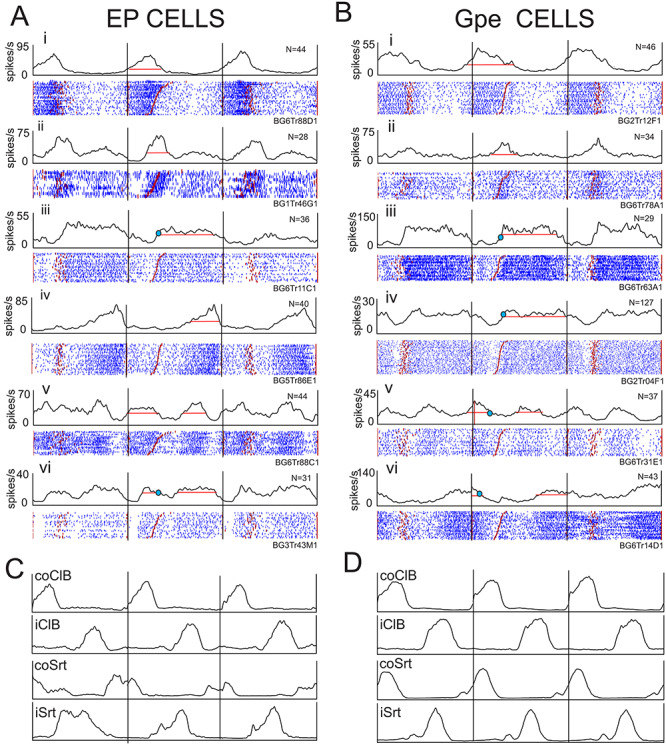
Figure 2.

Examples of discharge activity during unobstructed locomotion. A, B: 6 examples (i–vi) of cells recorded from the EP (A) and the GPe (B). For each cell, we illustrate perievent histograms (PEHs) and raster displays triggered on the onset of activity of the contralateral Br/ClB. In each case the central step cycle represents the cycle 2 (TM2) or 3 (TM1) steps before the step over the obstacle, together with the preceding and the following cycle. The black vertical lines delimit the three step cycles. The horizontal red line(s) through the PEH in the central cycle indicates the mean level of activity (see Methods). Cell activity in this and all other figures is rank-ordered according to the duration of the period of ClB/Br activity (red staggered lines in the raster displays). Small blue circles, when present, indicate the discharge frequency of the cell in the absence of locomotion (resting rate: data were not available for all cells). C, D: averaged EMG activity from the coClB and iClB, together with that from the contralateral and ipsilateral sartorius muscles (coSrt and iSrt, hindlimb flexor muscles), recorded simultaneously with the cell illustrated in Aiii for part C and simultaneously with the cell illustrated in Biv for part D.
