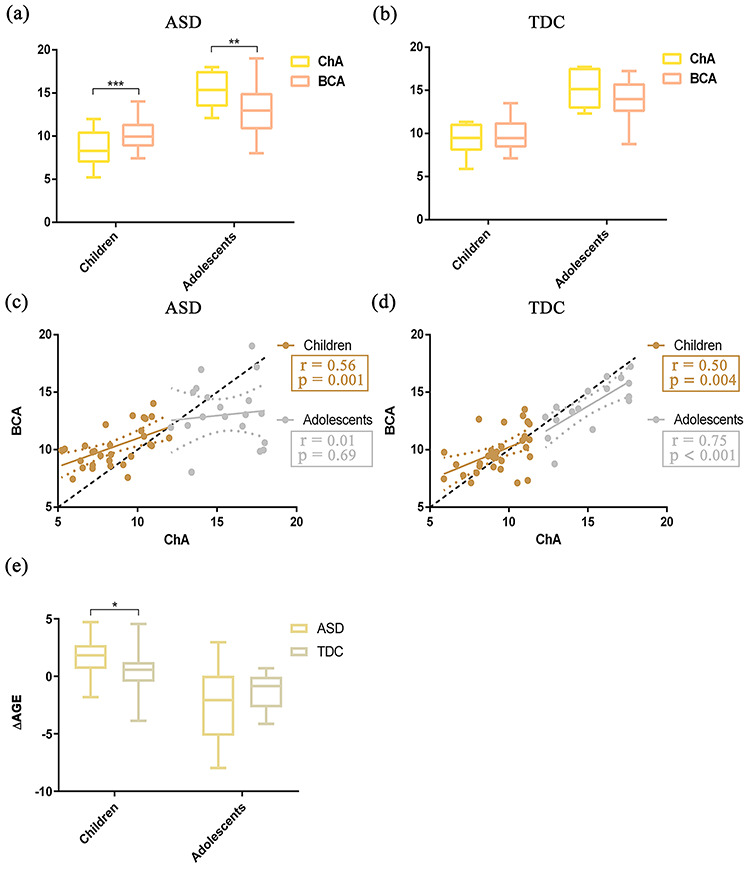
Figure 3.

Relationships between BCA and ChA and differences of ΔAGE in childhood and adolescence for the two groups ASD and TDC (childhood, age 5–12 years; adolescence, age 12–18 years). (a) Group differences between BCA and ChA in childhood and adolescent ASD. Yellow represents ChA and red represents BCA. Error bars indicate the range of values. (b) Similar to (a) but for TDC. (c) Correlation between BCA and ChA in the two regimes: childhood (gold) and adolescence (silver). (d) Similar to (c), but for TDC. Gold represents childhood and silver represents adolescence. The diagonal dashed line represents the line BCA = ChA. (e) Group difference of ΔAGE between ASD and TDC in childhood. Beige represents childhood ASD and gray represents childhood TDC. ΔAGE represents the difference of BCA from ChA (i.e., ΔAGE = BCA − ChA) (left). Similar to the left (e), but for adolescence (right). *P < 0.05, **P < 0.01, ***P < 0.001 after two-sample t-tests.
