
Figure 2.
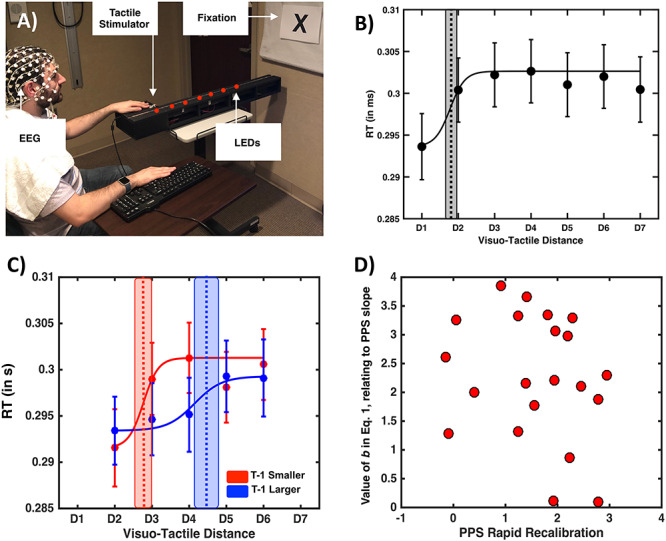
Behavioral results. (A) EEG setup. Participant’s viewed visual stimuli flash at different distances, while on given trials they simultaneously were given tactile stimulation on the hand. (B) Tactile RT (y-axis) as a function of visuo-tactile distance (x-axis). Dots illustrate the group average RT, while error bars illustrate ±1 SEM. Dashed vertical line is the mean central point of the sigmoidal function describing tactile RTs as a function of visuo-tactile distance, and gray shaded area around the vertical line is the uncertainty (SEM) associated with the central point estimate. (C) Tactile RT as a function of visuo-tactile distance (x-axis) and whether the precedent trial (i.e., t − 1) was one presenting a larger (blue) or smaller (red) visuo-tactile spatial disparity. The rest of conventions as in left panel. (D) Correlation between the degrees to which a particular participant’s PPS recalibrated as a function of the previous trial (x-axis) and parameter b in equation (1) (y-axis) regardless of the nature of the previous trial.