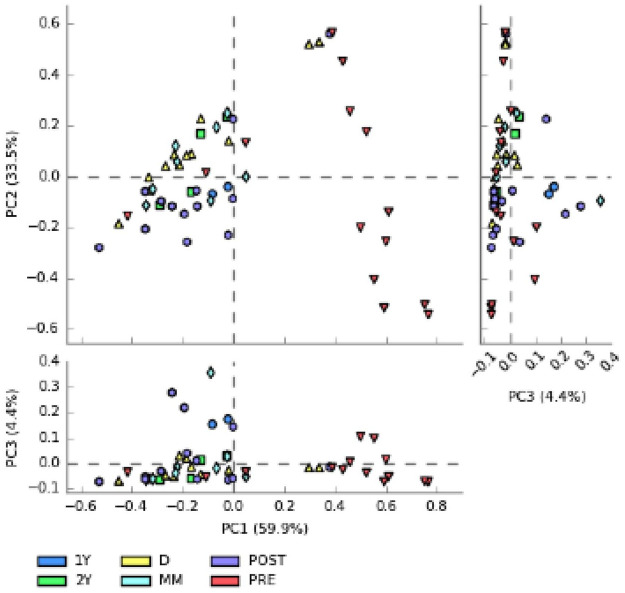
Figure 1.
Principal component analysis. We evaluated the differences between the principal components and the PC1, that is the most informative with the 59.9% of the variability. There is a separate cluster from the cloud of data, mainly characterized by PRE samples.
1Y: stool samples collected at 1 year post-FMT; 2Y: stool samples collected at 2 year post-FMT; D, donor’s stool samples; FMT, faecal microbiota transplantation; PRE: all recipient samples pre-FMT; MM: stool samples collected at 4–6 months post-FMT; PCA, principle component analysis; POST: all recipient samples post-FMT.

