
Figure 4.
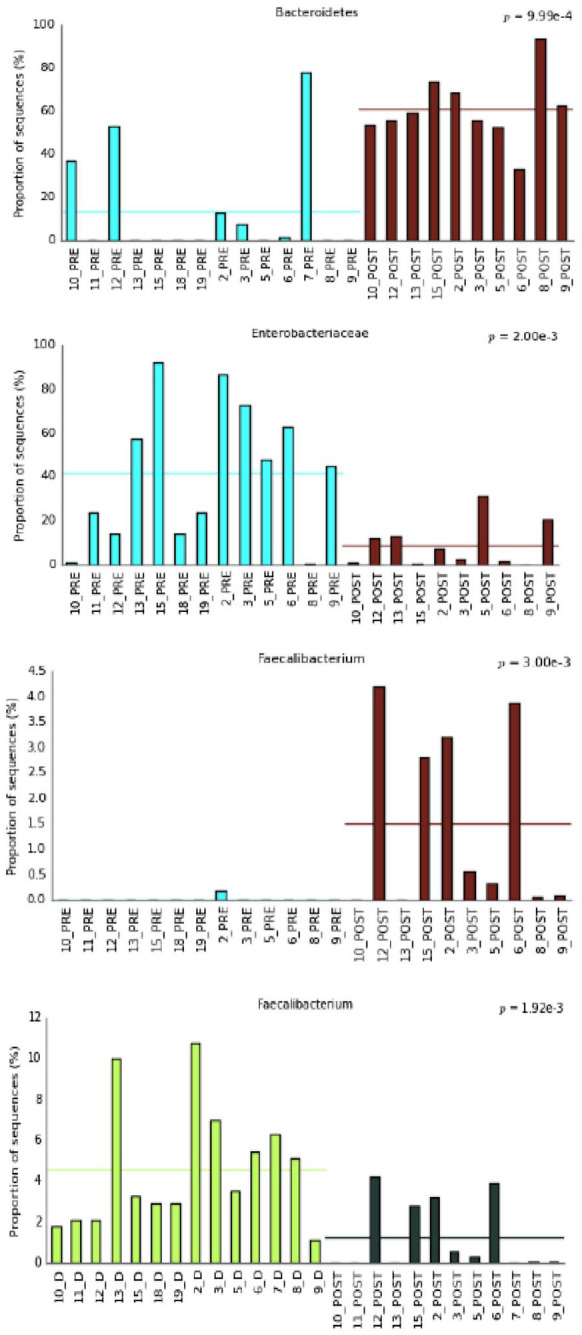
Bar plot showing statistically significant trends of taxa in the different patients.
D, donor’s stool samples; FMT, faecal microbiota transplantation; PRE: all recipient samples pre-FMT; POST: all recipient samples post-FMT.
Official websites use .gov
A
.gov website belongs to an official
government organization in the United States.
Secure .gov websites use HTTPS
A lock (
) or https:// means you've safely
connected to the .gov website. Share sensitive
information only on official, secure websites.
Bar plot showing statistically significant trends of taxa in the different patients.
D, donor’s stool samples; FMT, faecal microbiota transplantation; PRE: all recipient samples pre-FMT; POST: all recipient samples post-FMT.