
Figure 2. CDK7 Copy Number Loss Is Correlated with Increased Sensitivities to DNA-Damaging Drug Treatment.
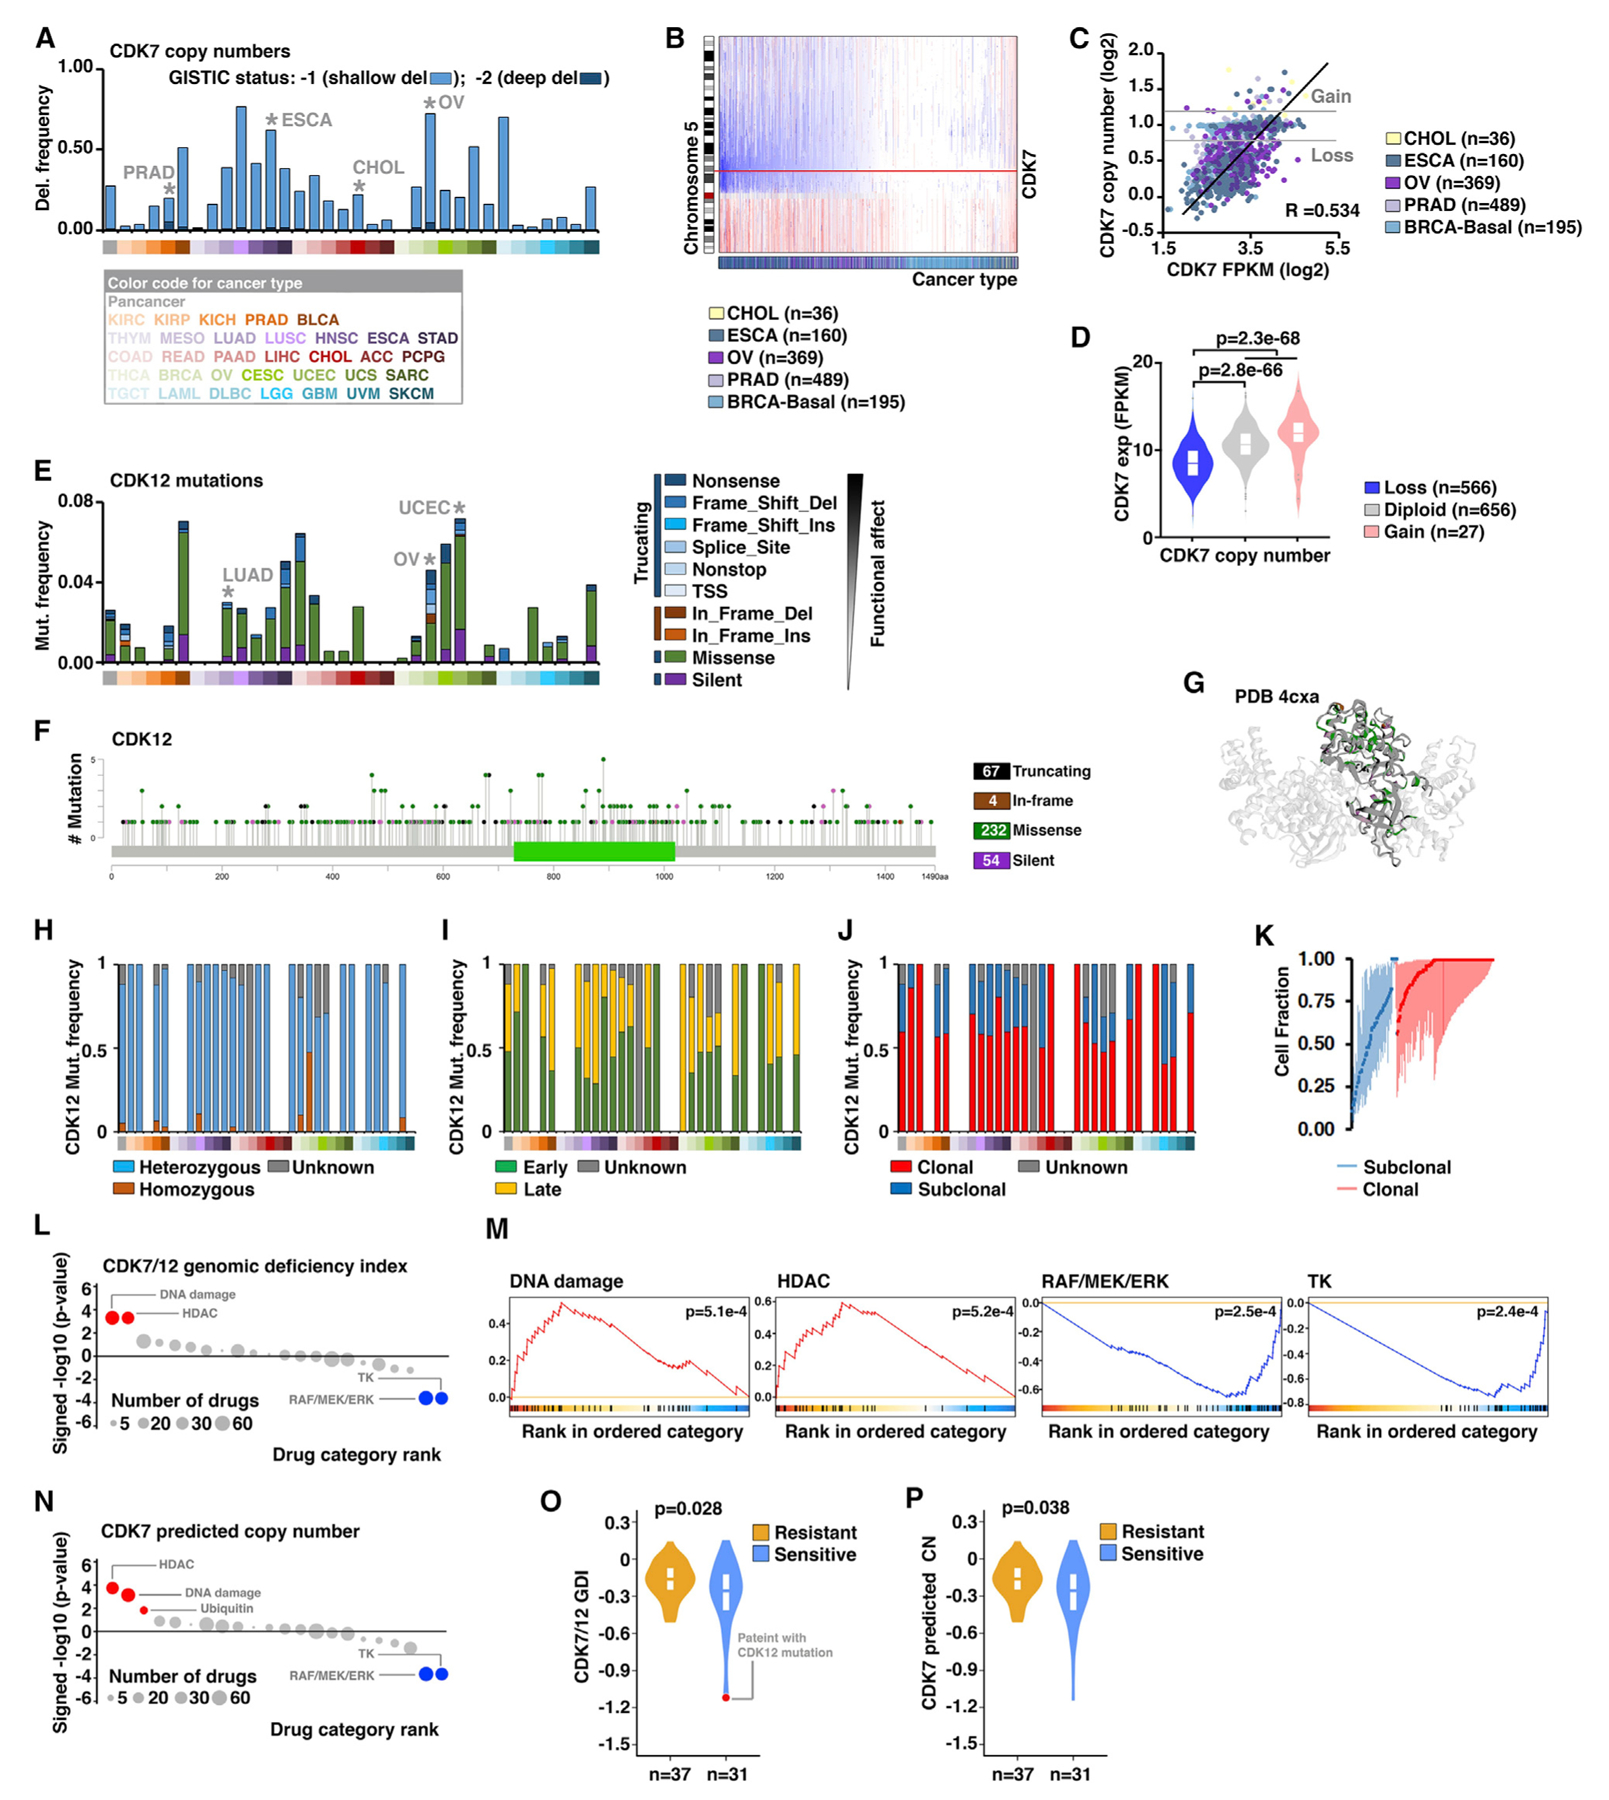
(A) The frequencies of CDK7 copy-number losses across 33 cancers: dark blue, deep deletion (GISTIC status, −2; possibly a homozygous deletion); light blue, shallow deletion (GISTIC status, −1; possible a heterozygous deletion). The cancer types with recurrent CDK7 deletions were indicated.
(B) Copy-number profiles of chromosome 5 across five cancer types, in which CDK7 copy number is recurrently lost. Each sample is represented with a vertical line, and the genomic locus of CDK7 is noted with a red horizontal line: blue, loss; red: gain.
(C) Scatterplot shows the correlation between CDK7 predicted copy number and expression across five cancer types with recurrent CDK7 loss.
(D) Violin plot shows the CDK7 expression levels among different CDK7 copy-number status groups across the five cancer types, using the same cancer types as in (C).
(E) The frequencies and types of CDK12 mutations across 33 cancer types. The cancer types with recurrent CDK7 mutations were indicated.
(F) The lollipop plots illustrate the distribution and categories of somatic mutations in the CDK12 gene-coding sequences across all cancer types. Note that, although mutations are randomly distributed along the entire coding sequence, the most frequent mutations are located within the catalytic domain.
(G) Ribbon drawings of the crystal structures of the kinase domain within CDK12 (4CXA). The different types of CDK12 mutations in the kinase domain were indicated by colors.
(H–J) The fractions of the mutation types (H), timing status (I), and clonal heterogeneity (J) of CDK12 in individual cancer types.
(K) Clonal heterogeneity of CDK12 across cancers. Based on the probability distributions of the cancer cell fractions, mutations were determined to be either clonal (red blocks) or subclonal (blue blocks).
(L) Dot plots show the significance of enrichment analysis (signed p value in the negative log10 scale) for all drug categories in association with CDK7/12 genomic-deficiency index (GDI). Drug categories are ordered according to their normalized enrichment score (NES). Drug categories with significant enrichment toward increased or decreased sensitivities in cell lines are shown in red or blue, respectively (false-discovery rate [FDR] < 10%). Drug categories with non-significant correlations are colored in gray. The size of each dot corresponds to the number of drugs in each category.
(M) Enrichment plots for selected drug categories in association with CDK7/12 GDI. Enrichment curves for drug categories with significant enrichment toward increased or decreased sensitivities in cell lines are colored in red or blue, respectively.
(N) Dot plots show the significance of enrichment analysis for all drug categories in association with CDK7 predicted copy number.
(O) The GDI of CDK7/12 between the chemo-sensitive and -resistant patients with ovarian cancer. The patient with a CDK12 mutation is indicated in red.
(P) The predicted copy numbers of CDK7 between the chemo-sensitive and -resistant patients with ovarian cancer.