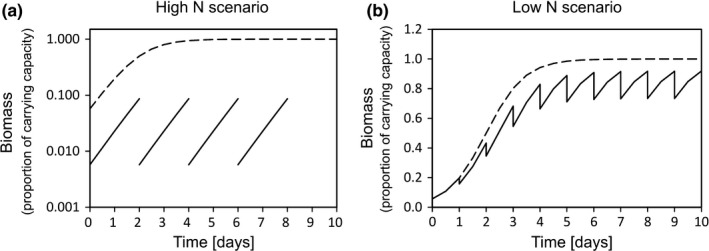
FIGURE 1.

Simulation of semicontinuous cultures for obtaining and maintaining (a) nutrient‐replete (high N scenario) and (b) nutrient‐limited (low N scenario) cultures. Simulation assumes cultures are already acclimated to the nutrient‐replete growth under defined temperature, irradiance, etc. Assumes logistic growth with the nutrient‐replete growth rate = 1.4 d−1, and carrying capacity = 1. Dilution is approximately 10‐fold in the high N scenario and 1.25‐fold in the low N scenario. Solid lines are the culture density. Dashed line is the culture density that would be obtained in a batch culture undergoing logistic growth. Note that (a) is on a log scale to represent that high N exponential cultures were kept at low densities far from reaching stationary phase, whereas (b) is on a linear scale
