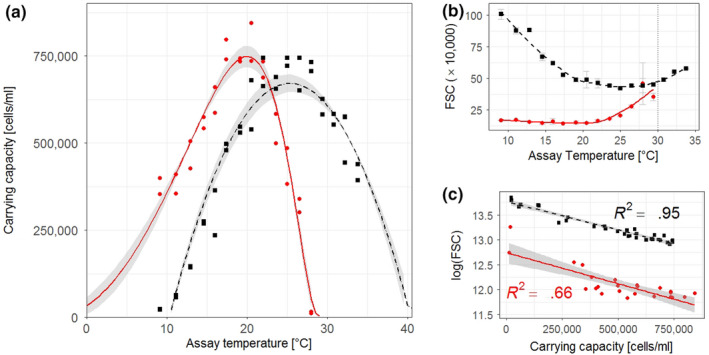
FIGURE 4.

(a) Temperature response curves of carrying capacity of Phaeodactylum tricornutum (red circles and solid line) and Thalassiosira pseudonana (black squares and dashed line) under nitrogen depleted conditions in the N‐limited phase of semicontinuous culturing in the low N medium (n = 2 for both species). Shaded area denotes standard deviation of the average model calculated from replicate model fits. Symbols show the carrying capacities from distinct biological replicates across the assay‐temperature range. Raw data used to calculate carrying capacities can be seen in Figure S8. Nonlinear model outputs of the single replicate models used to calculate the average model can be found in Table S4, and single model fits on the individual growth replicates can be found in Figure S2c. (b) Forward scatter (FSC) from flow cytometry data of the low N experiment across assay temperatures. FSC measurements depicted here were taken on the last day of replicate monocultures before they were mixed together for the competition experiment. The purpose of the solid and dashed LOESS lines is to visualize the U‐shaped trend of the data across assay temperatures (R 2 = 0.85, and RSE = 4.503 for Phaeodactylum tricornutum; R 2 = 0.97, and RSE = 3.378 for Thalassiosira pseudonana). LOESS was not used as a model to predict the relationship between temperature and cell size. Dotted line at 30°C indicates the critical maximum temperature for Phaeodactylum tricornutum beyond which it could not sustain growth. (c) Correlation between carrying capacity K and log(FSC) for both species. Solid and dashed lines are linear models of the regression
