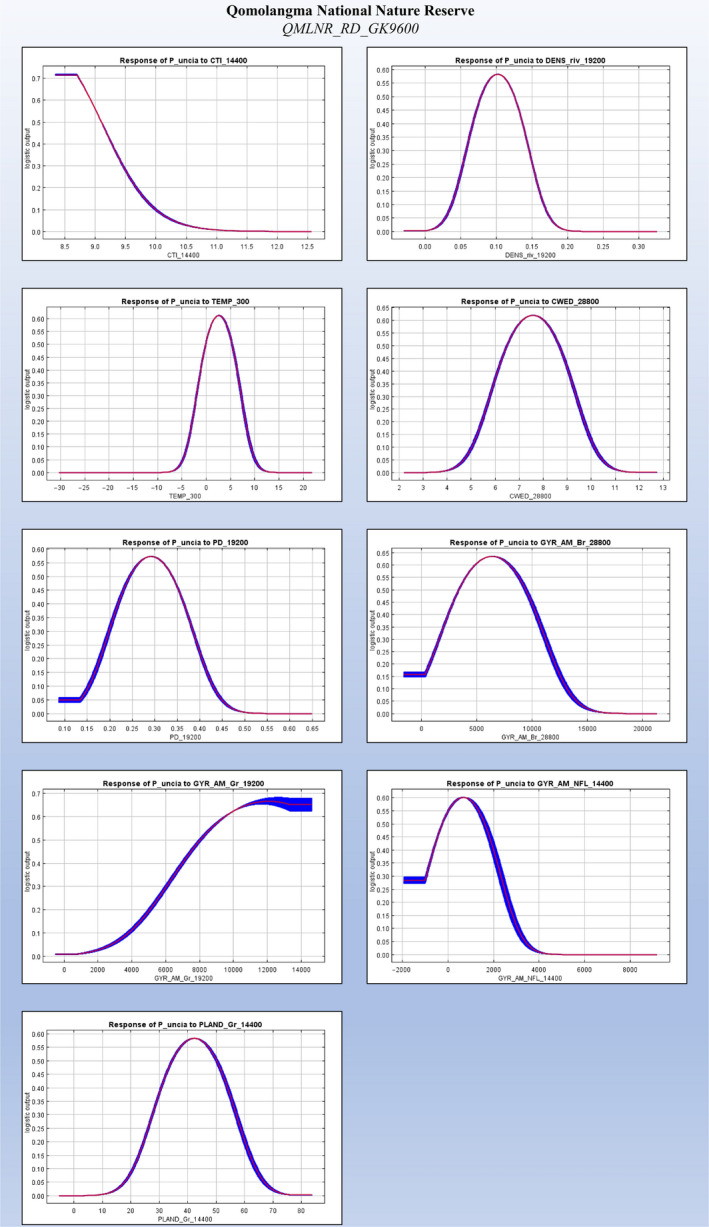
FIGURE 6.

Response curves for each of the unique variables included in the top five models, in Qomolangma National Nature Reserve (QMLNR), shown at their best correction. These curves represent snow leopard response when each variable is tested without interactions with other predictors
