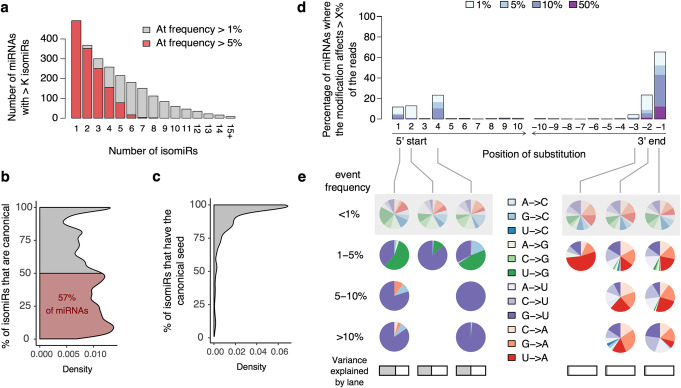
Fig. 2.
The landscape of miRNA diversity in human primary monocytes. a For each possible number of isomiRs K, number of miRNAs with more than K isomiRs at a frequency of > 5% or > 1%. b Distribution of the percentage of canonical isomiRs among all miRNAs; the area where the canonical isomiRs account for less than 50% of the reads is highlighted in red. c Distribution of the percentage of isomiRs with canonical seed among all miRNAs. d Distribution of edited nucleotides along miRNAs. For each nucleotide position, counting either from the 5′ start site (position 1 to 10) or from the 3′ end site (positions − 10 to − 1), we report the percentage of miRNAs that present an editing event accounting for > 1% of reads (light blue). Similarly, we quantified the fraction of miRNAs where the editing event accounts for > 5% (blue), > 10% (indigo), or > 50% (deep purple) of the reads. e Frequency of each type of substitution, according to the percentage of miRNA reads that are edited. Results are shown for positions where events were detected in > 1% of miRNAs. At each position, distribution of substitution types among low frequency editing events (< 1%), which we expect to be enriched in false positives, is provided as a reference (gray shadow). At each position, a horizontal gray bar indicates the variance in sample editing levels that is accounted for by the sequencing lane

