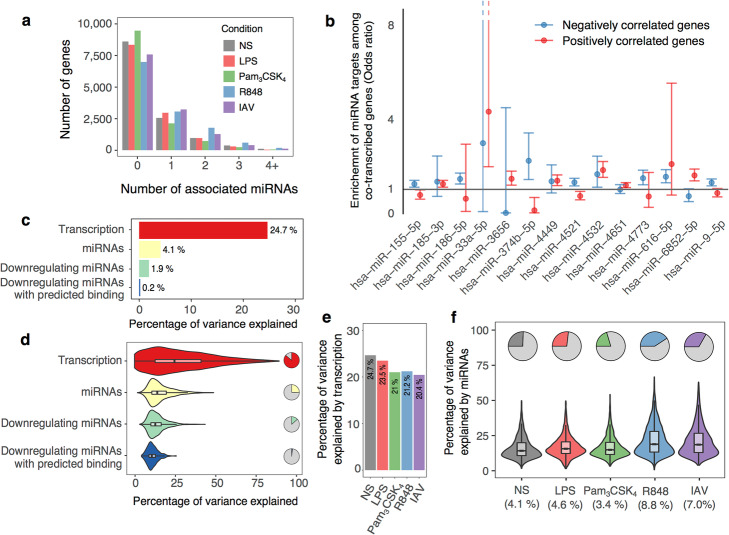
Fig. 6.
Impact of miRNA levels on gene expression. a Distribution of the number of associated miRNAs per gene according to the experimental condition. b Enrichment or depletion of miRNA targets among genes whose transcription level correlates with miRNA expression (co-transcribed genes). For each miRNA, odds ratios are reported separately for genes whose transcription is positively (red) or negatively (blue) correlated to miRNA expression. Enrichments are displayed only for miRNAs that have a significant enrichment of their targets in either positively or negatively correlated genes (5% FDR). c, d Percentage of gene expression variance that is attributable, at the basal state, to either transcription or miRNA variation. For miRNAs, attributable variance is also reported considering only negative associations, or negative associations with predicted binding between the gene and the miRNA. c Global percentages (average values across all genes). d Distribution at the gene level. Pie charts indicate the percentage of genes associated with transcription or miRNAs. Violin plots display the distribution of the variance attributable to each factor, among significantly-associated genes. e Global percentage of variance attributable to transcription according to the experimental condition. f Within each experimental condition, pie charts indicate the percentage of genes associated to at least one miRNA. Violin plots display the variance attributable to miRNAs among significantly associated genes

