
Figure 3. chα-GA1 reduces GA sequestration and improves cellular function.
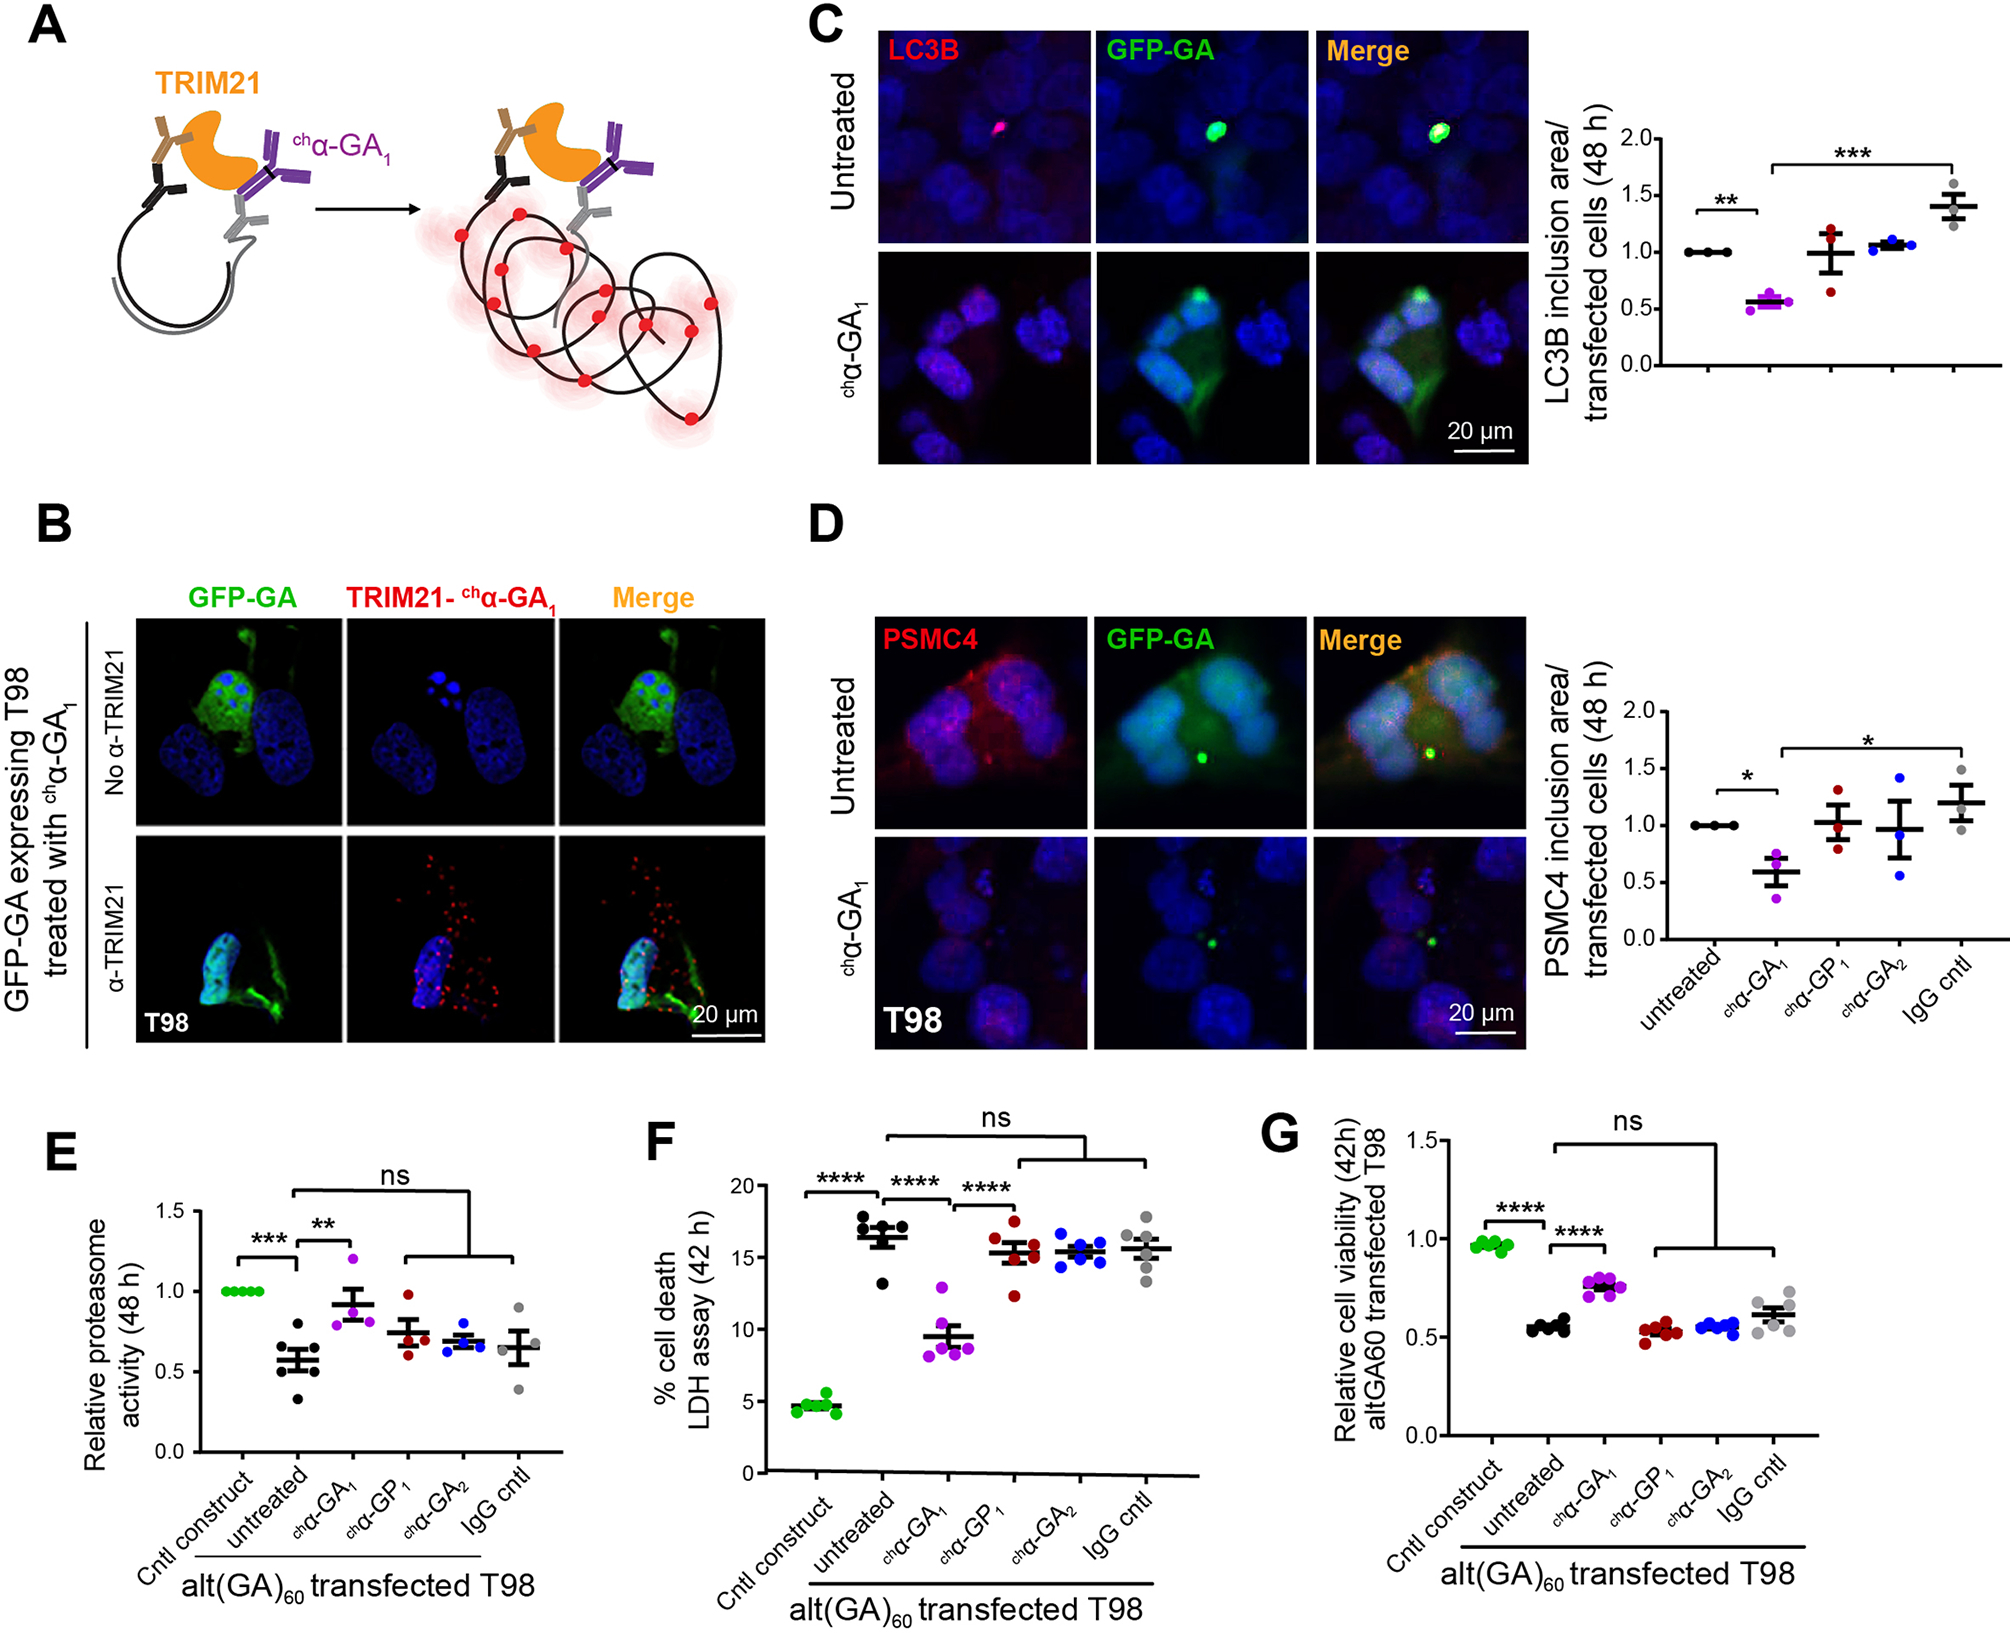
(A) Schematic diagram of the proximal ligation assay used to test TRIM21 and chα-GA1 interaction, α-TRIM21 (brown), secondary antibody for TRIM21 (black), secondary antibody for treated antibody (gray), amplified signals (red). (B) Double IF images of T98 cells expressing GFP-(GA)60 proteins show positive amplification signal (red puncta) showing TRIM21 and chα-GA1 interact or are in close proximity detected by proximity ligation assays. (C, D) Co-localization of GFP-GA with the autophagy marker LC3B (C) or the 26S proteasome subunit (D) in transfected T98 cells with or without antibodies (100 nM, 48 h) and quantification of LC3B (C) and 26S proteasome subunit (D) inclusions (n = 3, one-way ANOVA with Holm-Sidak analyses for multiple comparisons). (E) Proteasome activity in alt(GA)60 transfected T98 cells with or without chα-GA1 treatment (100 nM, 48h) (n ≥ 4, one-way ANOVA with Dunnett analyses for multiple comparisons). (F) Cell toxicity measured by LDH levels in cells transfected with alt(GA)60 with chα-GA1 treatment (1 μM, 42h), (n = 6). (G) Cell viability measured using MTT assays in cells overexpressing alt(GA)60 with chα-GA1 treatment (1 μM, 42h, n = 6). Graphs show mean ± SEM. One-way ANOVA with Sidak analyses for multiple comparisons. ns p > 0.05, * p ≤ 0.05, ** p ≤ 0.01, *** p ≤ 0.001. See also Figures S7–S9.