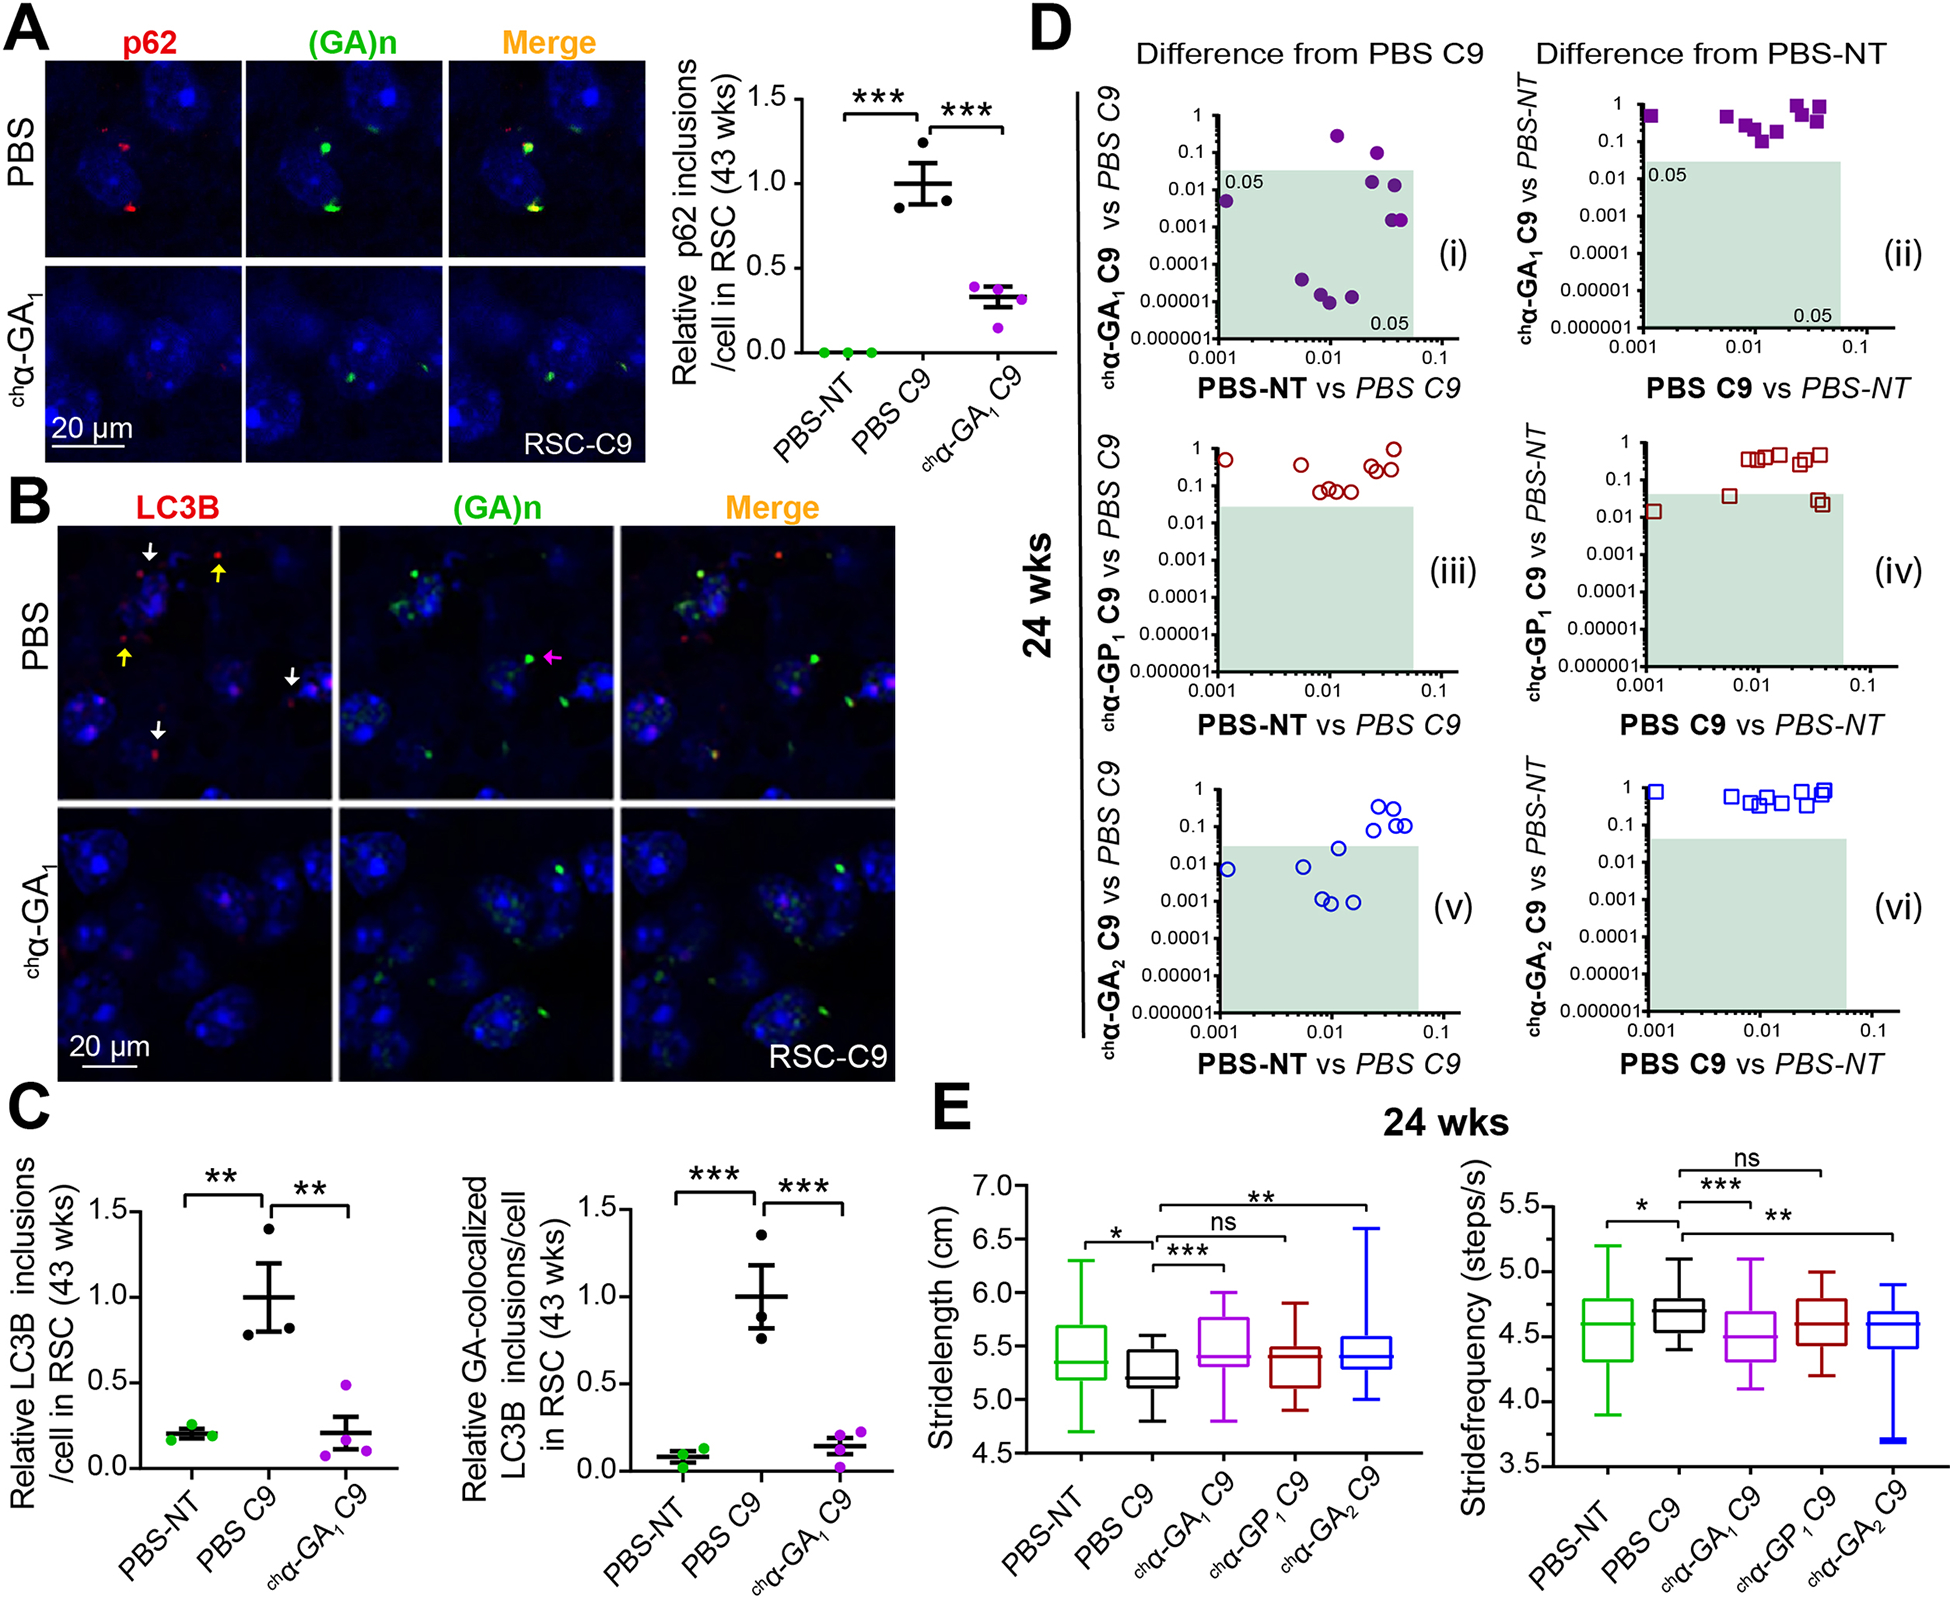
Figure. 6. chα-GA1 treatment decreases GA aggresome and improves gait behaviors in C9 mice.

(A) Double IF images showing co-localization of p62 (a-p62, red) and GA aggregates (α-GA1, green) and quantification of p62 inclusion in PBS or chα-GA1 treated mice. (B) Double IF images showing a subset of LC3B inclusions (a-LC3B, red) and GA aggregates (α-GA1, green) co-localize (white arrows), non-colocalized LC3B (yellow arrows), and non-colocalized GA aggregates (purple arrow) and reductions in LC3B staining after chα-GA1 treatment (C) Quantification of double-positive LC3B/GA inclusions in PBS and chα-GA1 treated mice. (A, C) Graphs show mean ±SEM, n ≥ 3, one-way ANOVA with Sidak analyses for multiple comparisons. (D) Comparisons of 11 C9 relevant DigiGait parameters among antibody treatment groups compared to PBS-C9 or PBS-NT cohorts at 24 wks. Green boxes define regions of significant difference found in antibody treatment cohorts compared to PBS treated C9 or PBS treated NT controls (p ≤ 0.05), n ≥ 17/group. (E) Representative DigiGait parameters corrected in treated chα-GA1 C9 cohort at 24 wks. Data show min to max, interquartile, and median. One-way ANOVA with Holm-Sidak analyses for multiple comparison. ns p > 0.05, * p ≤ 0.05, ** p ≤ 0.01, *** p ≤ 0.001. See also Figures S14 and S15.
