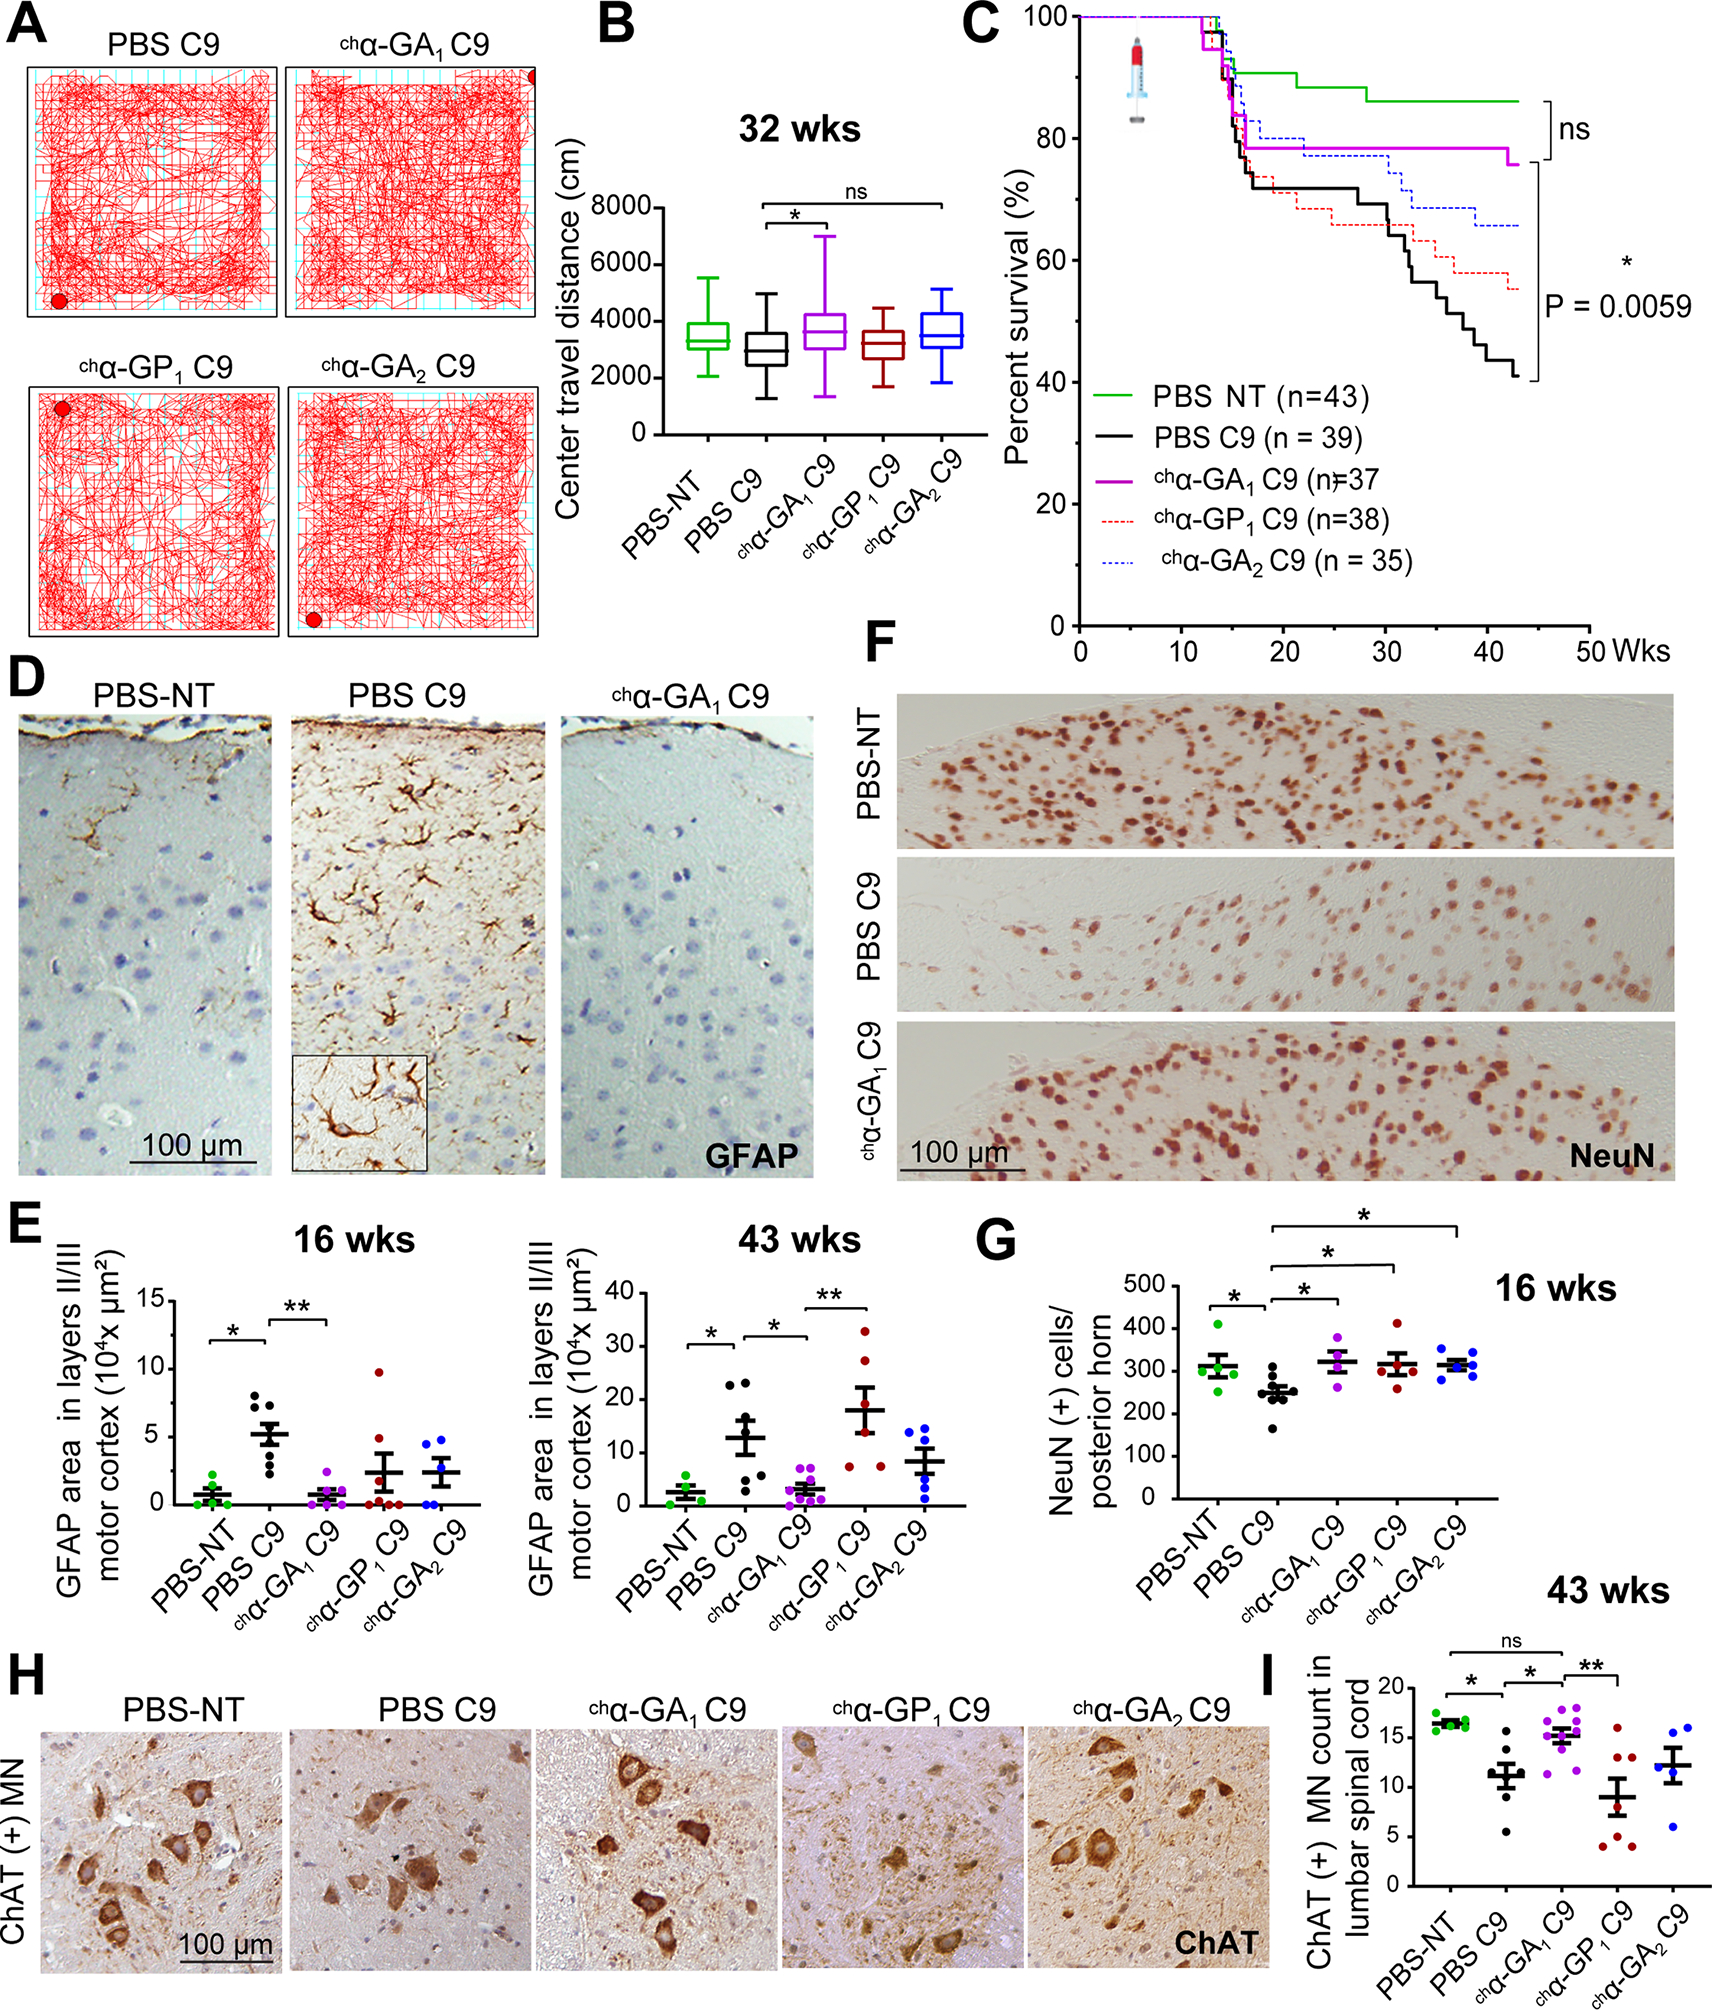
Figure 7. Improvements in open-field, survival, and neurodegeneration in C9 mice treated with GA targeting chα-GA1 antibody.

(A) Representative openfield traces of PBS, chα-GA1, ch α-GP1, and chα-GA2 treated animals taken after 15 min. (B) Center travel distance among treatment groups at 32 wks of age. n ≥ 17/group, one-way ANOVA with Sidak analyses for multiple comparisons. (C) Kaplan-Meier survival curvewith the Bonferroni analysis for multiple comparison, * p ≤ 0.025. (D, E) Representative GFAP staining (D) of PBS treated NT, PBS and chα-GA1 treated C9 animals with GFAP quantification (E) at 16 and 43 wks (n ≥ 5/group at 16 wks and for the 43 wk cohort n = 4 for PBS NT and ≥ 6/group for all other groups). (F, G) NeuN staining and NeuN(+) cell quantification at 16 wks (n ≥ 5 / group, one-way ANOVA, with Benjamini analyses for multiple comparisons). (H, I) ChAT+ motor neuron (MN) staining and quantification at 43 wks (n ≥ 5/group). One-way ANOVA with Holm-Sidak analyses for multiple comparison. ns p > 0.05, * p ≤ 0.05, ** p ≤ 0.01, *** p ≤ 0.001. See also Figures S16 and S17.
