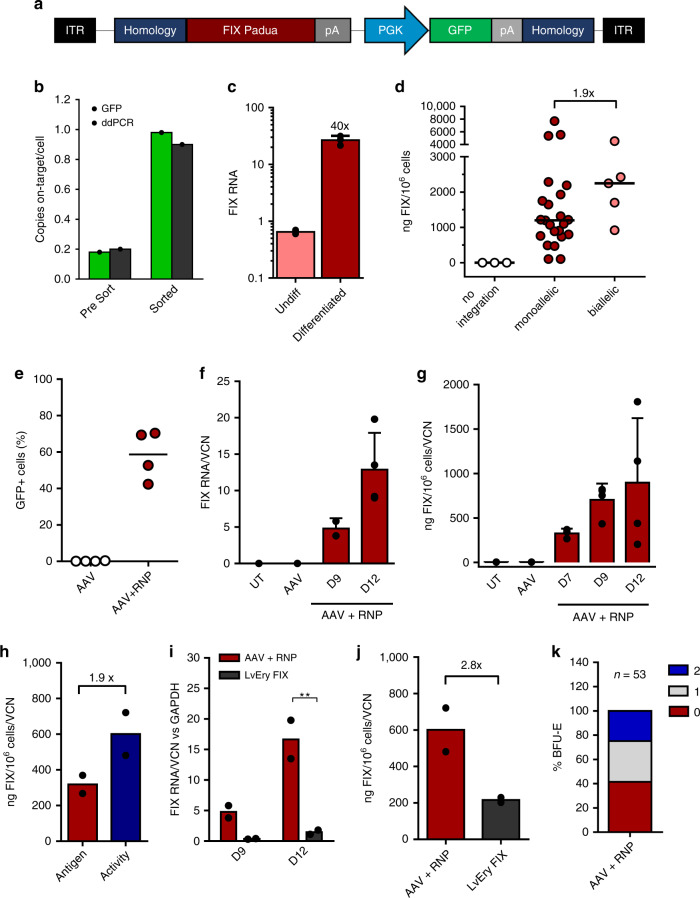
Fig. 3. F9 KI into the α-globin locus results in expression and secretion of functional enzyme.
a AAV6 donor used for KI experiments of FIX Padua. b FIX KI efficiency in HUDEP-2 cells was measured by flow cytometry (light green) or ddPCR specific for on-target integration (dark green) before and after sorting (n = 1). c Quantification of FIX mRNA in KI HUDEP-2 upon differentiation (mean ± SD, n = 2 undifferentiated, n = 3 differentiated). d Quantification of FIX secretion in medium of HUDEP-2 clones (n = 28) with monoallelic or biallelic KI (ELISA), as detected by on target ddPCR analysis (AAV-genome junction amplification). Lines represent median. e KI efficiency in HSPCs at day 9 of erythroid differentiation. Lines represent mean (n = 4). f, g FIX expression during HSPC differentiation at RNA (f, qPCR; n = 2 day 9; n = 4 day 12) and protein level (g, ELISA on supernatants, n = 3 day 7; n = 4 day 9 and 12; 3 donors). Bars represent mean ± SD. h Comparison of FIX antigen (ELISA) and activity (aPTT) in supernatants of KI HSPCs (mean; n = 2). i, j Comparison of FIX RNA at day 9 and 12 of erythroid differentiation (i) and protein (j) in KI HSPCs (AAV + RNP) vs HSPCs transduced with an erythroid-specific lentiviral vector (LvEry FIX). Bars represent mean (**p = 0.003 t-test Holm-Sidak correction for RNA at day 12; p = 0.08 for protein, n = 2). k Integration pattern in single BFU-E (2 donors): no integration (0), monoallelic (1) and biallelic KI (2). Source data are in the Source Data file.

