
Figure 1.
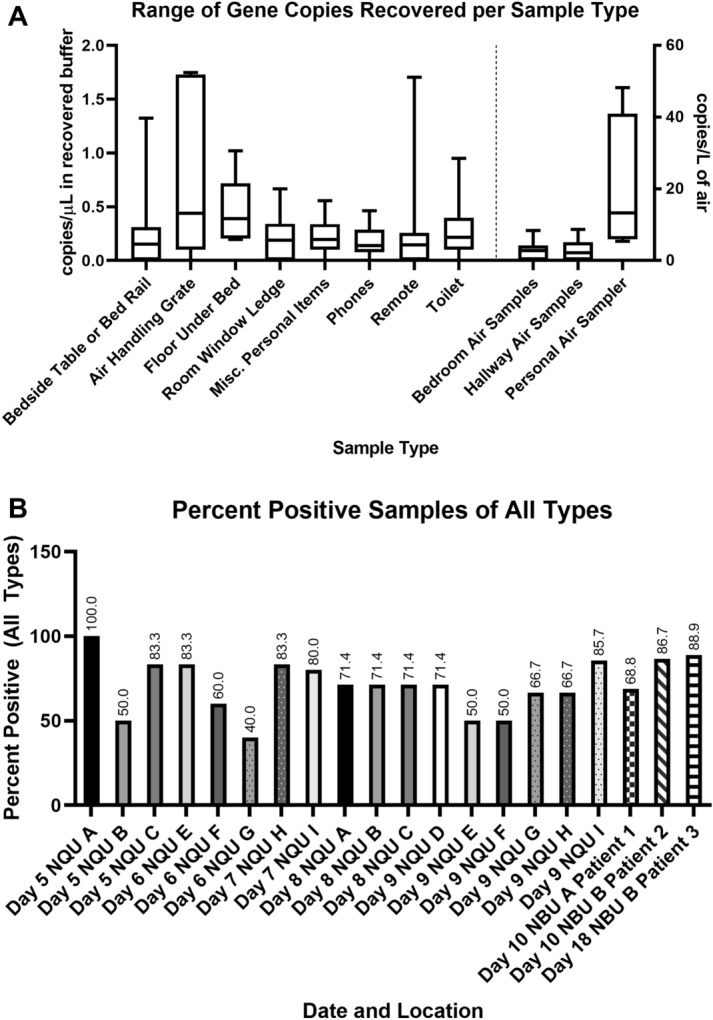
A Box and whisker plot demonstrating the max and min (whiskers), median (line) and 25th and 75th percentile gene copy concentrations (copies/µL) for all types of samples collected in this study. Data is presented as a concentration in recovered buffer (sterile PBS) for each sample. Surface samples were in a total of 18 mL (3 mL to pre-moisten and 15 mL to recover), bedroom air and hallway air samples were recovered in 15 mL total, while personal air samples were recovered in 10 mL of sterile PBS. B Percentage of positive samples recovered in each room sampling. Bar patterns from the same room and same individual on multiple dates are identical.