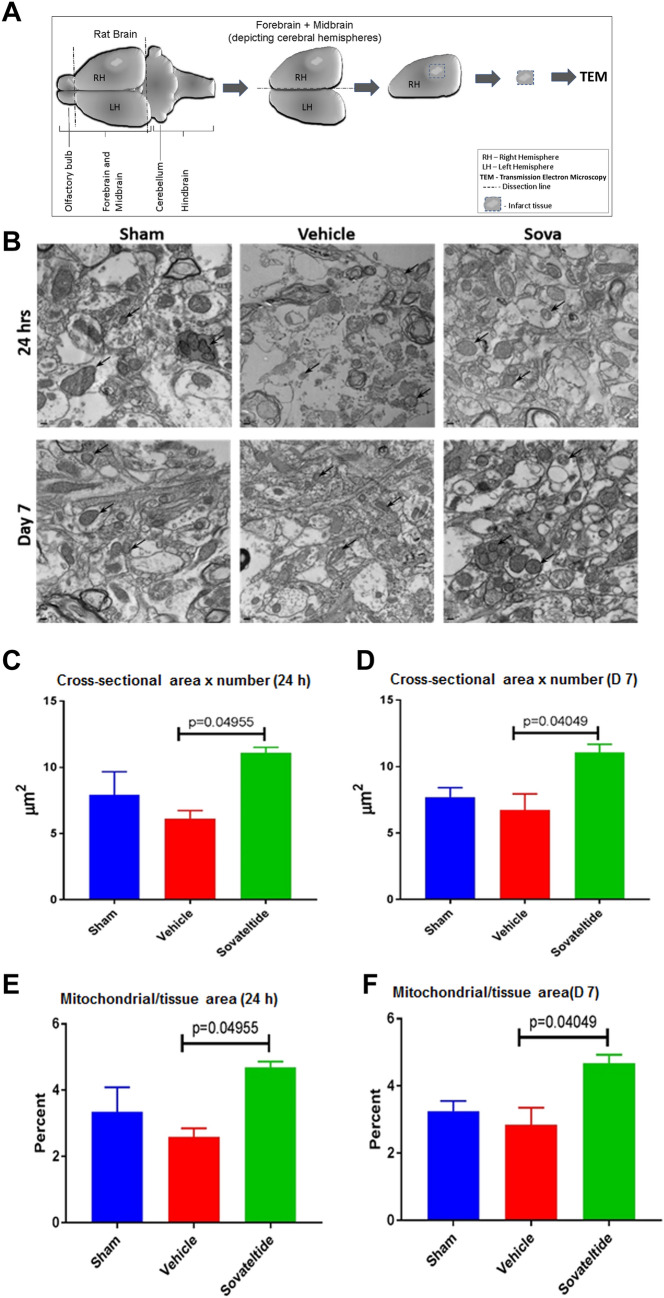
Figure 6.
Transmission electron microscopic (TEM) analysis of mitochondria in brain tissues. (A) Diagrammatic representation of dissection of adult rat brain and tissue sectioning for TEM. (B) representative TEM images of sham, vehicle and sovateltide (Sova) treated rat right hemisphere (RH) brain tissues at 24 h and day 7 post MCAO (supporting images are provided in Fig. S4). Black arrows indicate representative mitochondria. Image magnification 3,000×, scale bar = 0.2 µm. (B) Measurement of mitochondrial cross-sectional area × number at 24 h and day 7 post MCAO, respectively. (C) Measurement of percent mitochondrial to tissue area ratio at 24 h and day 7 post MCAO, respectively. Values are expressed as mean ± SEM (B,C).

