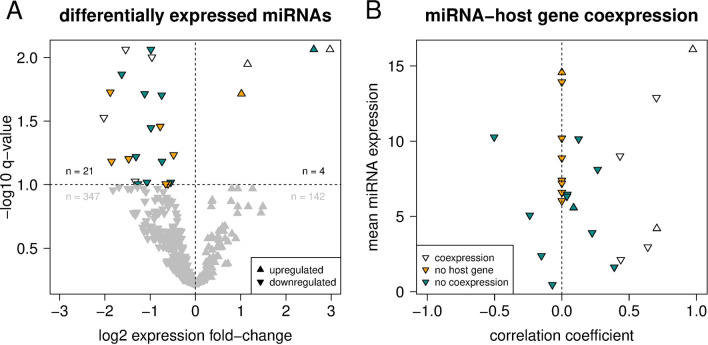
Figure 3.
Differentially expressed miRNAs and co-expression of miRNAs and their host genes. (A) Volcano plot showing the relative expression change of 514 miRNAs between patients from the short-lived and long-lived subgroup. miRNAs with a significant change in expression (q < 0.1) are colored, others in gray. (B) Correlation of miRNA and corresponding host gene expression values across 42 DNMT3A-mutated patients. Pearson correlation coefficients were set to zero (dashed vertical line, yellow coloring) for miRNAs without a protein-coding host gene. For both figure panels, triangles indicate miRNAs that show (white) or do not show (turquoise) a significant coexpression (positive correlation) with their respective host gene (q < 0.1).

