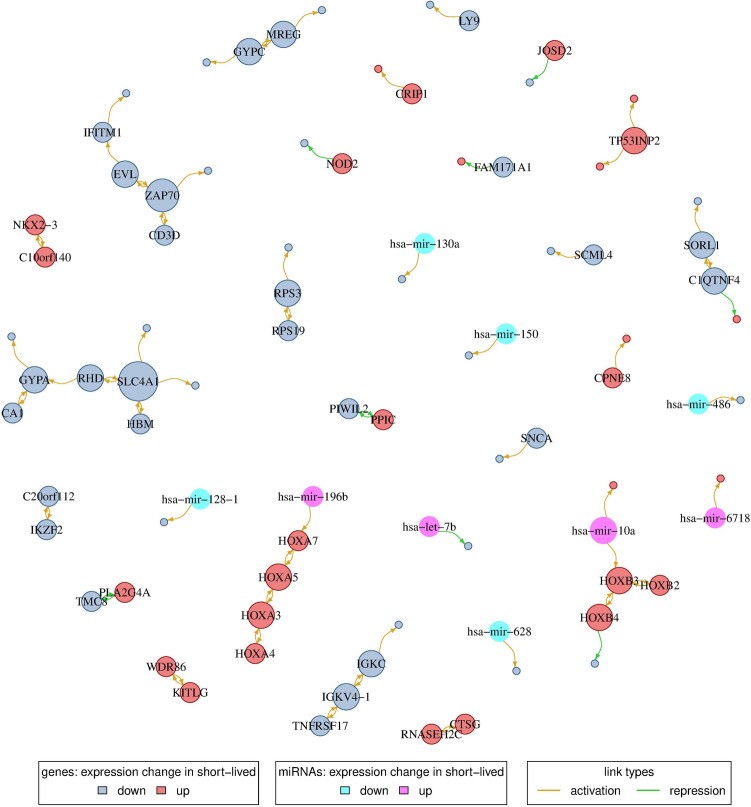
Figure 4.
Gene and miRNA regulatory network. Nodes represent either genes that are differentially expressed between the two patient subgroups or miRNAs selected as predictors during network inference. Nodes are colored according to whether a gene/miRNA shows an increase or decrease in expression in the short-lived relative to the long-lived patient subgroup. Gene/miRNA names are shown for putative regulator nodes (out-degree > 0) with node sizes being proportional to their out-degree. Potential activating and repressing links are shown in yellow and green color, respectively; only links present in at least two-thirds of the networks were considered. Note that links can represent direct or indirect regulatory dependencies or may only represent correlations.

