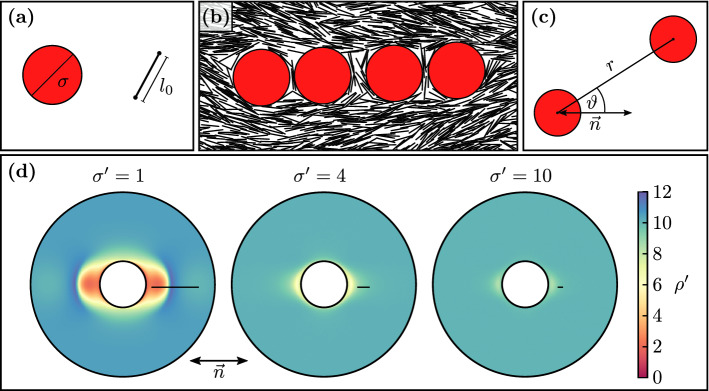
Figure 1.
(a) Simulated particles: hard disks with diameter and hard needles with characteristic length . (b) Simulation snapshot of disks () forming chains along the director (approximately in horizontal direction). On the outer disks and between disks surface depletion zones with low needle density form. (c) Disk distance r and disks angle towards the director are used to describe the potential of mean force as well as other interactions. (d) Needle center of mass density distribution around a disk, relative to the director for different relative disk sizes (scale bars are one needle length ). For small disks, there are distinct depletion zones in front of and behind a disk. Depletion zone extensions are . Overlap of these depletion zones gives rise to the density-dependent depletion interaction. (Figure created using gnuplot 5.2 (http://www.gnuplot.info/), matplotlib 3.2.1 (https://matplotlib.org/), python 3.8.2 (https://www.python.org/), inkscape 0.92.5 (https://inkscape.org/)).

