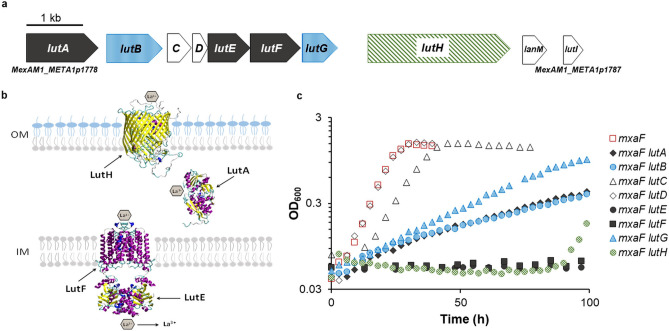
Figure 4.
Characterization of the lut cluster. (a) Genomic map of the lut genes (MexAM1_META1p1778 to MexAM1_META1p1787). Black, genes encoding the ABC transport system; green, gene encoding the TonB-dependent transporter; blue, genes encoding putative periplasmic proteins identified by transposon mutagenesis; white, lanmodulin and additional genes encoding periplasmic proteins not identified by transposon mutagenesis. (b) Model for Ln transport. The three-dimensional structures of monomers of LutH and LutA were predicted using homology modeling (HHpredserver and MODELLER)37 and homodimers of the ABC transporter were predicted using GalaxyHomomer38. (c) Growth of mxaF and mxaF lut mutant strains with 2 μM LaCl3. Graphs depict representative data from three biological replicates. Growth rate averages and standard deviations are shown in Table 2.

