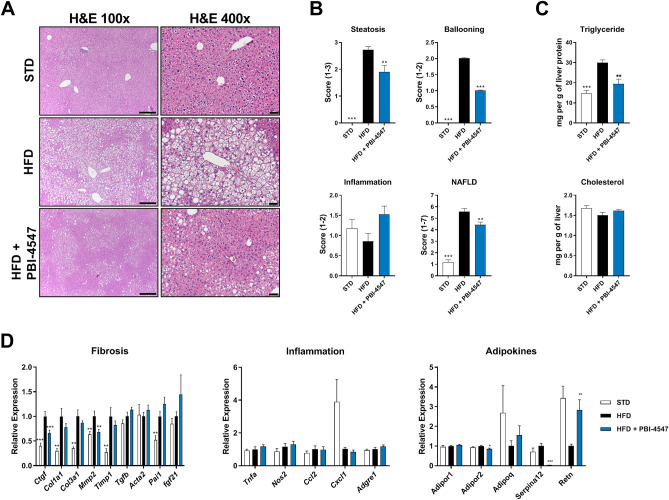
Figure 3.
Effects of PBI-4547 intervention on NAFLD development. (A) Representative image of HE-stained liver section of STD, HFD and HFD + PBI-4547 mice. (B) Scoring of steatosis, ballooning, inflammation and total NAFLD score in liver sections of the mice. (C) Quantification of hepatic triglyceride and cholesterol levels. (D) Relative expression levels of genes involved in fibrosis, inflammation and with adipokine. Mean expression of qRT-PCR data was set to 1 for HFD group. Data are presented as mean ± SEM (n ≥ 6 per group, one-way ANOVA with Dunnett’s multicomparison test vs HFD group).

