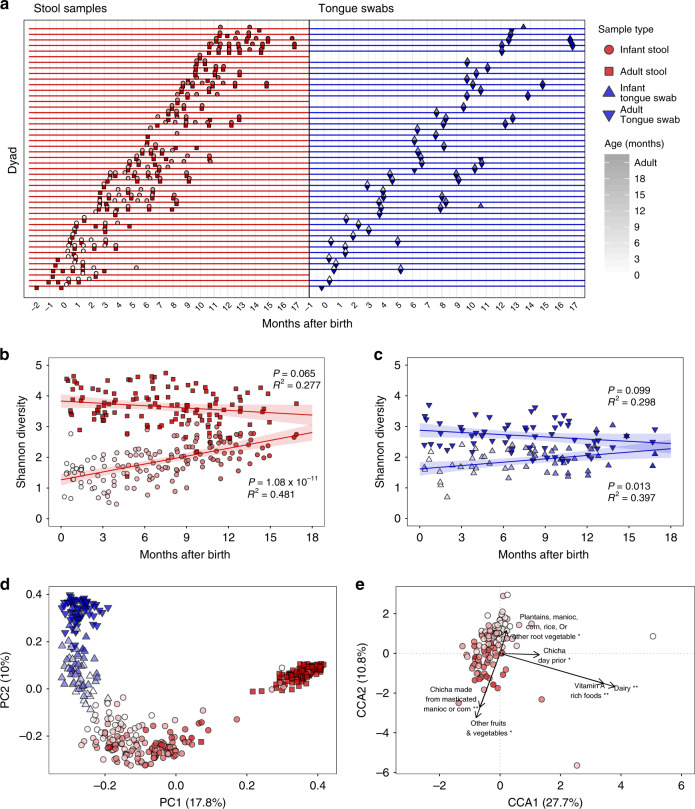
Fig. 1. Infant microbiota dynamics and dietary factors associated with maturation.
a Timeline denoting fecal sample and tongue swab collections for each mother–child dyad relative to the infant’s birth date. For maternal samples, time refers to the immediate postpartum period. Infant stool samples are circles, adult stool samples are squares, infant and adult tongue swabs are triangles that point up or down, respectively. Shapes are colored by sample type (red = stool, blue = tongue swabs), and the color darkens as the subject’s age increases. Shapes and colors are consistent across a–e. b Shannon diversity index regressed against the time since the infant’s birth for stool samples (adult stool: P = .065, R2 = 0.277; infant stool: P = 1.08 × 10⁻¹¹, R2 = 0.481). Lines indicate the linear mixed-effects regression of diversity on time since delivery, while treating subject as a random effect. The shading indicates the 95% confidence interval. The conditional R2 describes the proportion of variation explained by both the fixed and random factors, and was calculated using the R package, “piecewiseSEM”. c Shannon diversity index regressed against the time since the infant’s birth for tongue swab samples (adult tongue swabs: P = .099, R2 = 0.298; infant tongue swabs: P = .013, R2 = 0.397). Figure details are the same as in (b). d Principal coordinate analysis (PCoA) using a distance matrix calculated using the Jaccard similarity index of microbiota taxa composition in stool samples and tongue swabs from Tsimane dyads. e A partial canonical correspondence analysis (CCA) of ASV abundances, constrained against a matrix of diet survey data. The effects of infant age and village were controlled using a conditioning matrix. Significance was assessed using an ANOVA-like permutation test with 1000 permutations. Source data are provided in the Source Data file.

