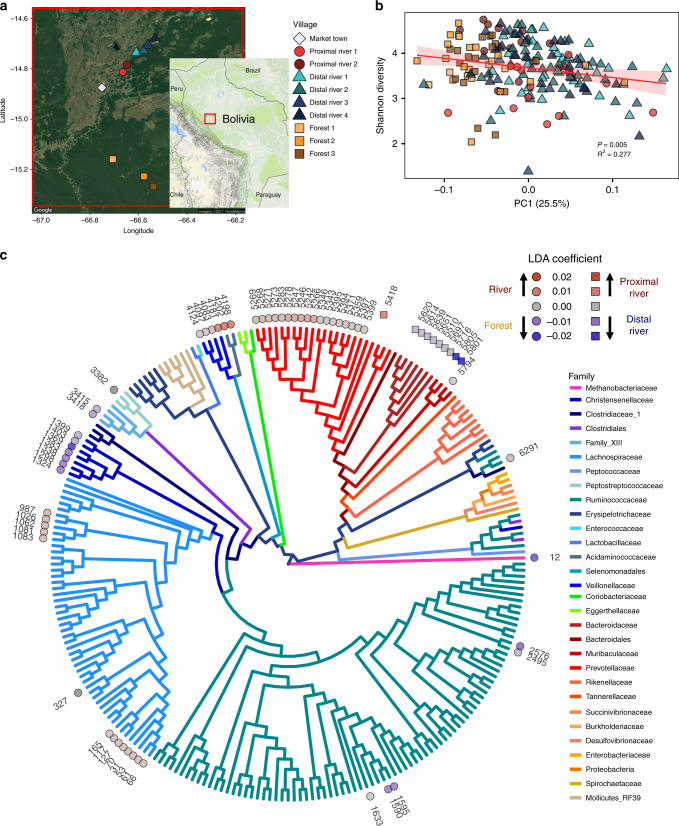
Fig. 5. Market access is associated with Tsimane gut microbiota structure and diversity.
a A map showing the location of the nine Tsimane villages whence stool samples were collected. The map insert denotes the region of Bolivia being displayed. Map data: Google, TerraMetrics. b Shannon diversity index plotted against the PC1 value from Supplementary Fig. 10 (P = .005, R2 = 0.277). The red line indicates the linear mixed-effects regression while treating subject as a random effect, and shading indicates the 95% confidence interval. The conditional R2 describes the proportion of the variation explained by both fixed and random factors. Samples are colored by village and their shapes denote the village type (proximal river villages—circles, distal river villages—triangles, forest villages—squares). c Phylogenetic tree with ASVs found at least 10 times in at least 20% of Tsimane adult stool samples. Discriminatory ASVs were identified using the tree-based LDA algorithm in the treeDA R package. ASVs are denoted by shapes based on two sets of comparisons (circles for river vs. forest, and squares for proximal river vs. distal river), and are colored based on their discriminatory strength. ASVs are colored by the taxonomic family and significantly discriminatory ASVs are labeled with their ASV number. Source data are provided in the Source Data file.

