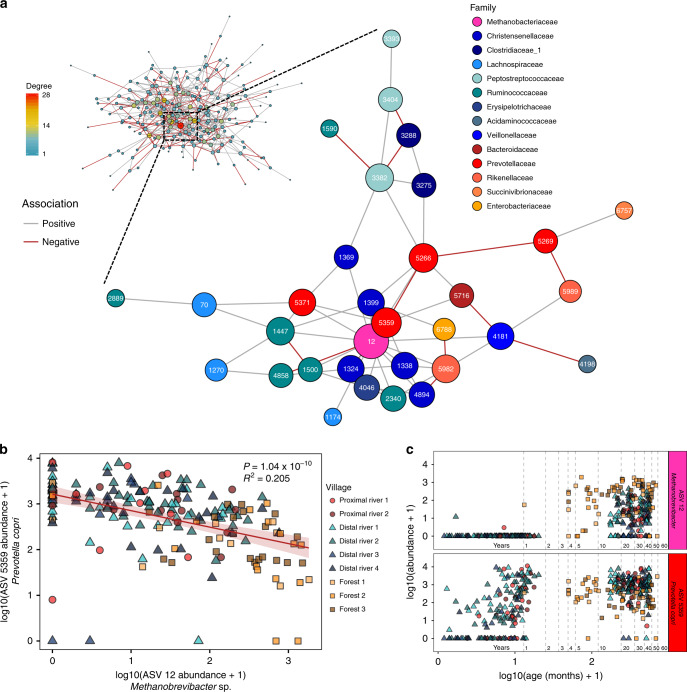
Fig. 6. Network analysis reveals an inverse relationship between highly connected taxa.
a A network diagram of ASVs observed at least ten times in at least 20% of Tsimane adult stool samples. The size of the node was scaled to represent its degree of connectedness. The insert shows the complete network colored by network degree, while the main figure shows the highly connected subgraph colored by each ASV’s taxonomic family. Positive associations between ASV nodes are colored gray, while negative associations are colored red. b A scatter plot of the log10 transformed relative abundances of the two most highly connected ASVs in the network, Methanobrevibacter spp. (ASV 12) and Prevotella copri (ASV 5359) (P = 1.04 × 10⁻¹⁰, R2 = 0.205). The red line indicates the linear mixed-effects regression while treating subject as a random effect, and shading indicates the 95% confidence interval. The marginal R2 describes the proportion of variation explained by the fixed factors alone, and was calculated using the R package, “piecewiseSEM”. Samples are colored by village, and their shapes represent the village type (proximal river—circles, distal river—triangles, forest—squares). c Scatter plot of the relative abundances of Methanobrevibacter spp. (ASV 12) and Prevotella copri (ASV 5359) and the subject’s age in months at the time of collection. The x-axis was log10 transformed for clarity when plotting both infant and adult samples. Ages 1–5, 10, 20, 30, 40, 50, and 60 years are denoted by horizontal dashed lines. Source data are provided in the Source Data file.

