Figure 1.
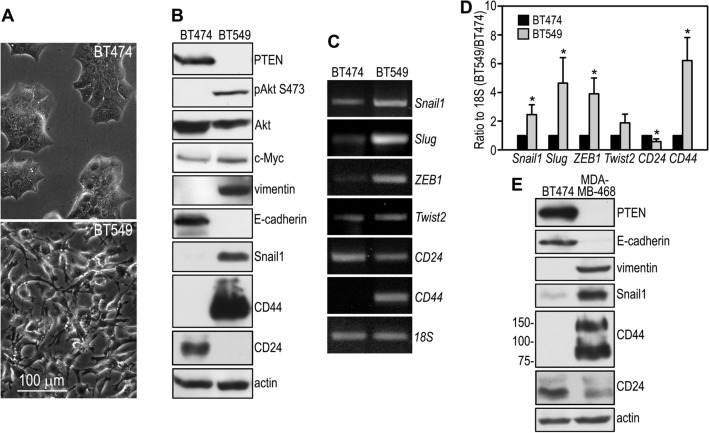
PTEN expression correlates with the EMT and stem cell signature in breast cancer cells. (A) Phase contrast micrographs show that BT474 breast cancer cells display an epithelial morphology while BT549 cells assume a mesenchymal, fibroblast-like shape. (B) Confluent BT474 and BT549 cells were analyzed by immunoblotting. Actin served as a loading control. (C) RT-PCR analysis of BT474 and BT549 cells for the expression of the EMT-inducing transcription factors, CD44, and CD24. 18S was used as a loading control. (D) Ethidium bromide-stained PCR products were quantified by densitometry and plotted as a ratio to 18S. N = 3, *P < 0.05 versus BT474. (E) BT474 and MDA-MB-468 cells were cultured to confluence and subjected to immunoblot analysis. Actin was used as a loading control.

