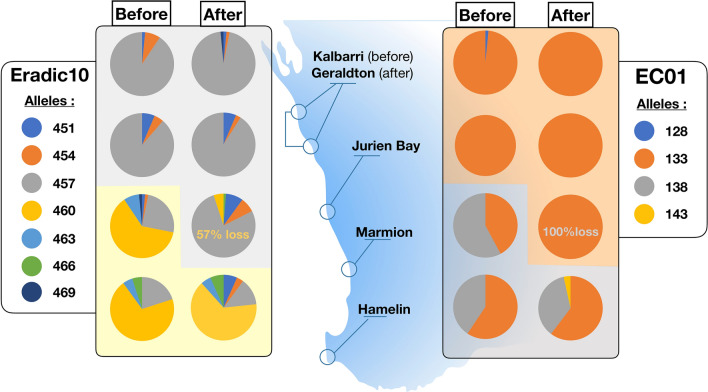
Figure 4.
Examples of change in allelic frequencies of two microsatellite loci contributing to genetic tropicalisation at Marmion [Eradic10 (n = 26–40) and EC01 (n = 30–40)]. Background shading represents the northern and southern clusters identified from STRUCTURE (v 2.3.4; https://web.stanford.edu/group/pritchardlab/structure) (K = 2; Fig. 3) and are coloured according to the major allele frequency driving change from before to after. The percent loss of the major “cool” alleles (460 and 138) at Marmion is also shown.

