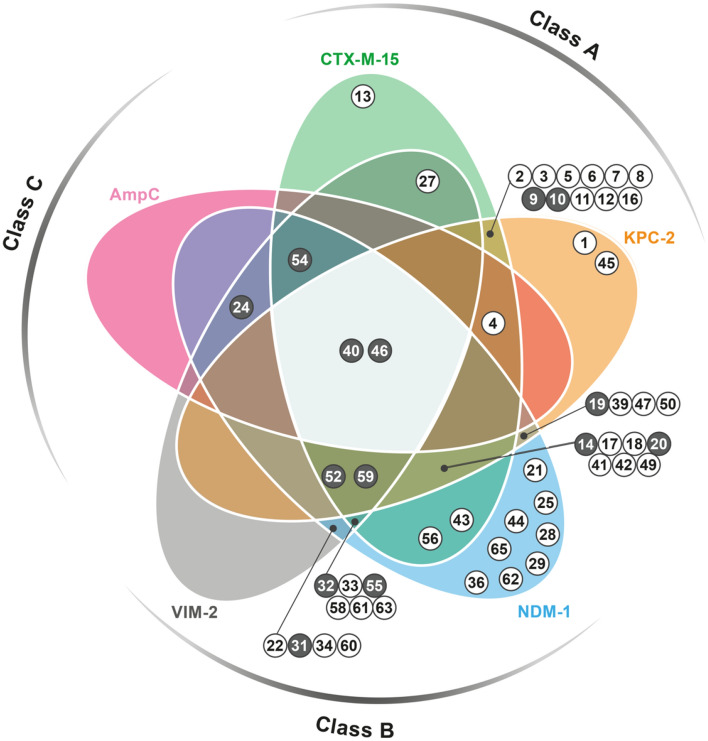
Chart 1.
Venn diagram reporting the inhibition profile of active compounds towards the BLs panel. Each coloured area refers to a specific BL: CTX-M-15 green, KPC-2 orange, NDM-1 blue, VIM-2 grey, AmpC, pink. Compounds showing inhibition ranging 50–70% or > 70% towards, at least, one target are represented by white-filled and grey-filled circles, respectively, and are located under the curve belonging to that specific enzyme. Those exerting a minimum 30% inhibition towards other BLs are located in overlapping areas. The inhibition percentage exact values are reported in Table 1.

