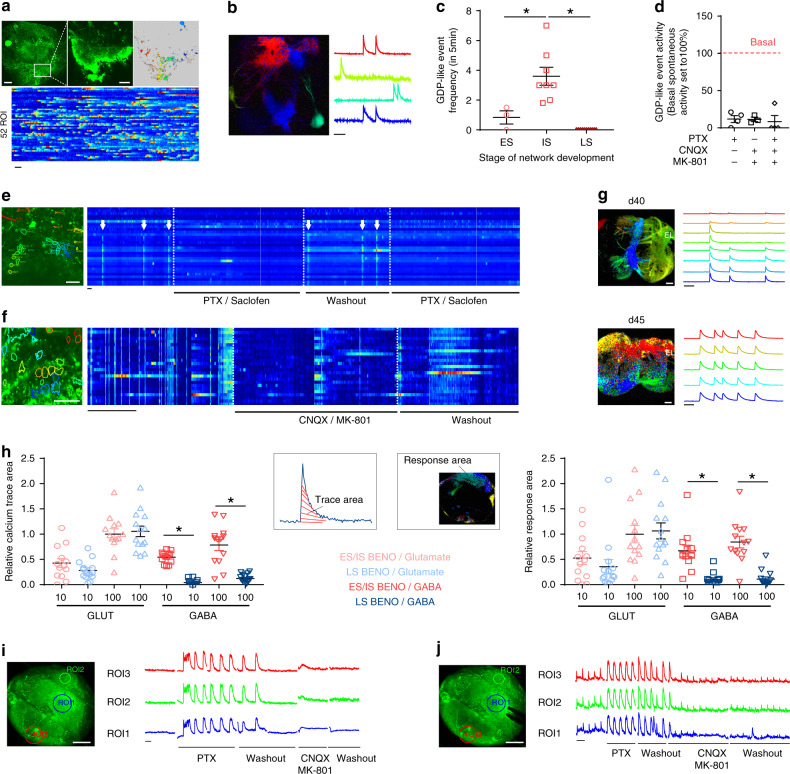
Fig. 4. Development of neuronal networks during BENO generation.
a Calcium activity in d21 BENO. Upper-left: overview of the complete organoid loaded with the calcium indicator Fluo-8-AM. Upper-middle: close-up view of the boxed area. Upper-right: active correlation map of different regions of interest (ROI) showing calcium activity; each ROI is representative for a specific neuronal activity. Bottom: heat map of calcium activity of 52 neurons as a function of time. b Active correlation map of d35 BENO and color-coded calcium traces (ΔF/F0) showing GDP-like events (refer also to Supplementary Videos). c GDP-like event frequency at early stage (ES, d < 25), intermediate stage (IS, 25 < d < 40), late stage (LS, 40 < d < 65); n = 15 organoids, 2 independent experiments, * P values for ES vs IS and IS vs LS were 0.0035 and <0.0001, respectively, one-way ANOVA with Sidak’s multiple comparisons post hoc test. d GDP-like event inhibition by PTX, CNQX, and MK-801; n = 3-4 organoids/group, 2 independent experiments. e, f, close-up view showing synchronized calcium activity (indicated by arrows) of individual neurons in d36 BENOs. Heat maps of 20–30 ROIs showing desynchronization upon GABA receptor blockade by PTX/Saclofen (e) and glutamate receptor blockade by CNQX/MK-801 (f); note that upon washout synchronicity was restored. g Overview of calcium activity propagation induced by single pulses (100 µA) in the same fused BENOs on d40 (1 mm signal propagation relative to stimulation electrode) and on d45 (2 mm signal propagation relative to stimulation electrode). h In ES and IS BENOs, GDP-like events were evoked by 10 and 100 µmol/L GABA or 10 and 100 µmol/L glutamic acid (calcium signals recorded from 3 independent organoids; symbols indicate data from 15 ROIs). In LS BENOs GDP-like events were evoked by glutamate, but not GABA (calcium signals recorded from 3 organoids of 1 experiment; symbols indicate data from 15 ROIs). Bar graphs summarize calcium trace area (left) and signal strength in response area (right), indicating the extent of the neuronal activity in the investigated BENO. Values were normalized to 100 µmol/L glutamate responses in ES/IS and LS organoids; For relative trace area the p values of 10 and 100 µmol/L GABA ES vs LS were 0.002 and <0.0001, respectively. For relative response area the p values of 10 and 100 µmol/L GABA ES vs LS were 0.027 and 0.0011, respectively; one-way ANOVA with Tukey’s multiple comparisons post hoc test. i Representative traces of spontaneous calcium activity under GABAergic and glutamatergic inhibition in LS BENOs (representative image from ROIs recorded in 3 BENOs). j Electrical stimulation-induced calcium activity under GABAergic and glutamatergic inhibition in LS BENOs (representative image from ROIs recorded in 1 of 3 BENOs, n = 3 organoids, 2 independent experiments). Spontaneous and induced activity was enhanced under GABA receptor blockade, while induced activity under glutamatergic inhibition was reduced. Upon washout the network balance was restored. Scale bars: Overview 200 µm; high magnification 50 µm. All time scale bars on calcium traces are 30 s. Data are presented as mean values ± SEM.

