Figure 1.
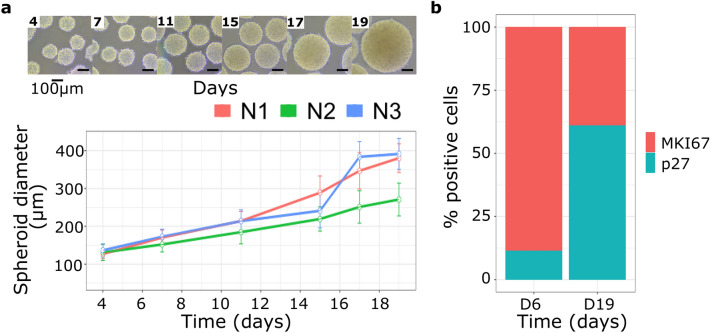
(a) Multicellular Cancer Tumor Spheroids of breast cancer cell line MCF7 diameter along time. We performed three independent biological replicates of the MCF7-MCTS culture kinetic denoted as N1, N2 and N3. Points and bars represent the average Feret diameter with their respective standard deviation for each replicate and time-point. Values can be found in Supplementary Table S1. (b) Immunophenotyping with flow cytometry analysis measuring MKI67 and p27 biomarkers at days 6 and 19, expression of both markers for the two-time points showed statistical difference with a p value < 0.05 using a non-paired t-student test with equality of variances.

