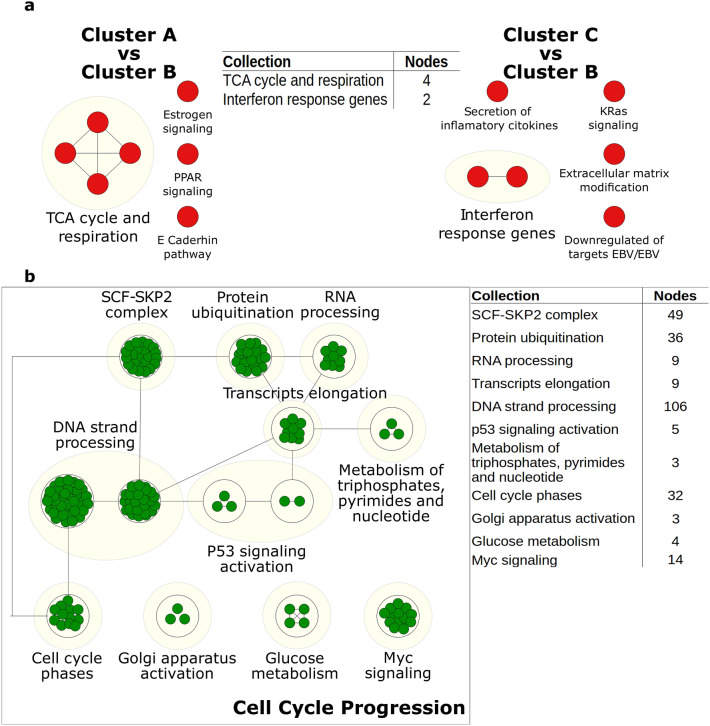
Figure 5.
Positive enriched maps, each green and red circles are nodes that represent a pathway. Yellow circles related a collection with a biological function; tables show the number of pathways enriched in every collection. Links between pathways were established when 2 pathways or collections had a Jaccard index > 0.4 by the expressed genes. All the enriched pathways have an FDR < 0.05 and a p value < 0.01. (a) Enriched pathways for cluster B given the paired-comparison with other clusters. (b) Enriched pathways for cluster C, black square associate all collections with a high-end biological process.

