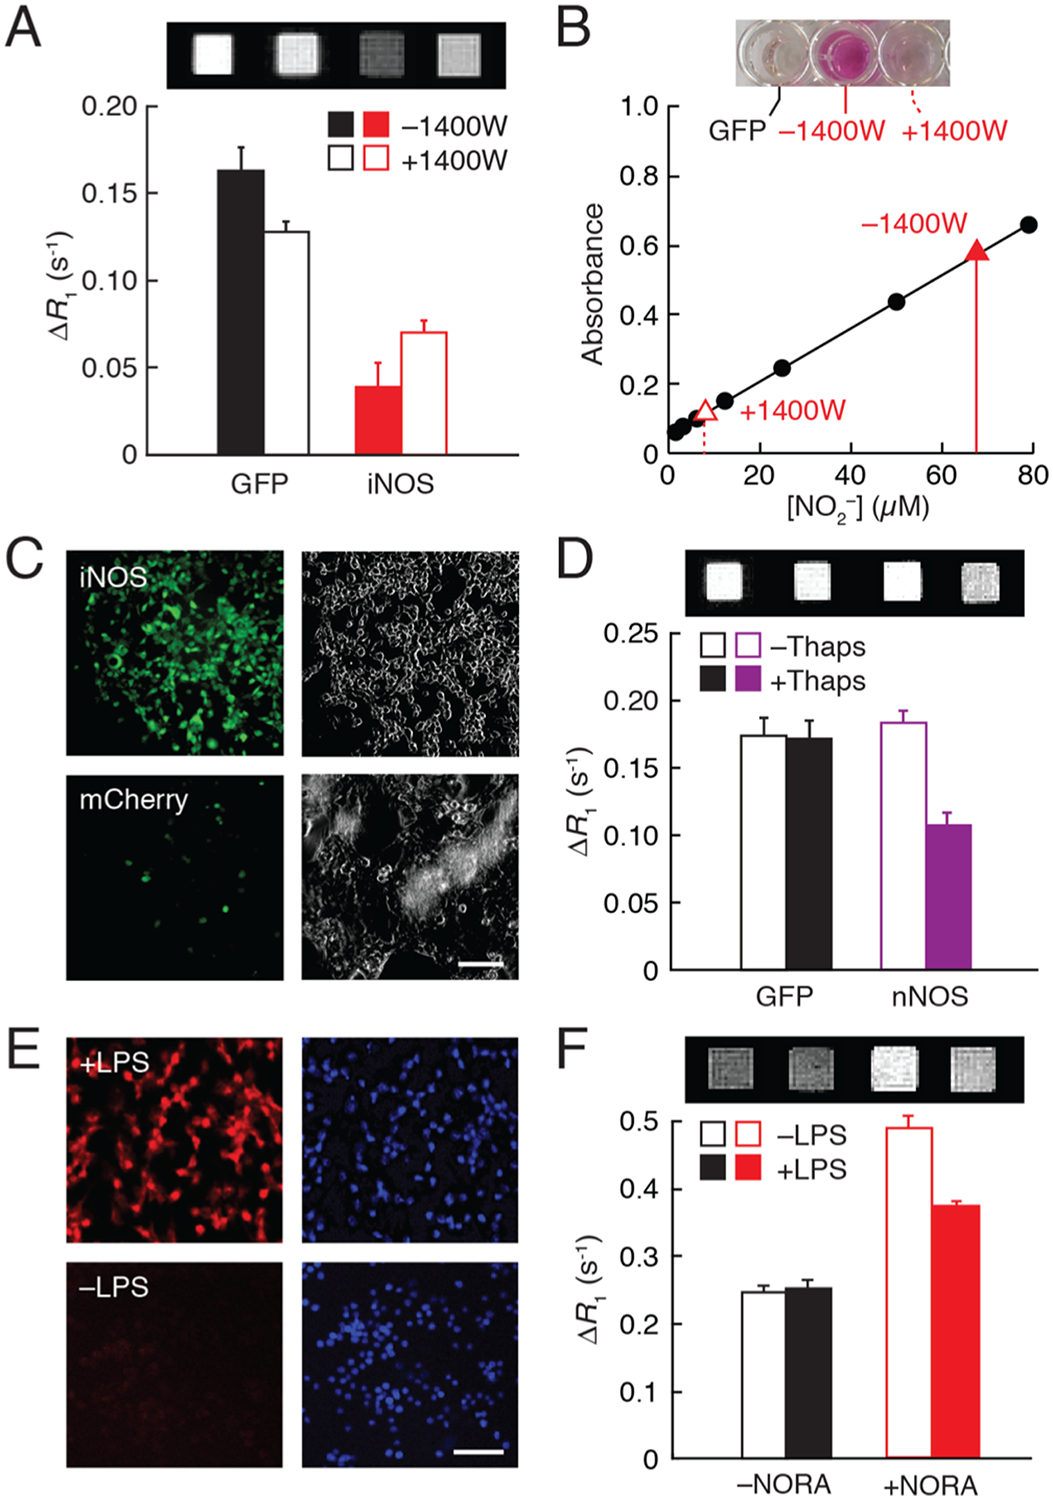
Figure 3.

Measurement of NO production in cells. (A) Relaxation rate differences at 7 T and 22 °C, with respect to unlabeled cells, exhibited by 20 μM NORA-labeled cells transfected with GFP or iNOS and untreated or treated with 100 μM of iNOS inhibitor 1400 W. Corresponding T1-weighted images of cell pellets at the top. (B) Griess assay of nitrite production by iNOS-expressing cells in the presence or absence of 1400 W (red) with respect to calibration points (black). Images of assay wells from GFP- and iNOS-expressing cells ±1400 W at the top. (C) Micrographs of iNOS-expressing cells (top) or control mCherry-expressing cells (bottom) treated with the NO indicator DAF-FM (left). Scattering signal (right) reveals both stained and unstained cells. (D) Relaxation rate differences with respect to vehicle-treated cells exhibited by GFP- or nNOS-expressing cells after treatment with 20 μM NORA in the presence or absence of 1 μM thapsigargin (Thaps). T1-weighted MRI scans shown at the top. (E) Micrographs of macrophage cells treated with 5 μM NO indicator DAR-4M AM (left) in the presence (top) and absence (bottom) of LPS stimulation. Nuclear (DAPI) staining shown at the right. (F) R1 differences from buffer for macrophages incubated without or with NORA in the presence and absence of LPS; corresponding images at the top. All error bars represent s.e.m. (n ≥ 2). Scale bars = 50 μm.
