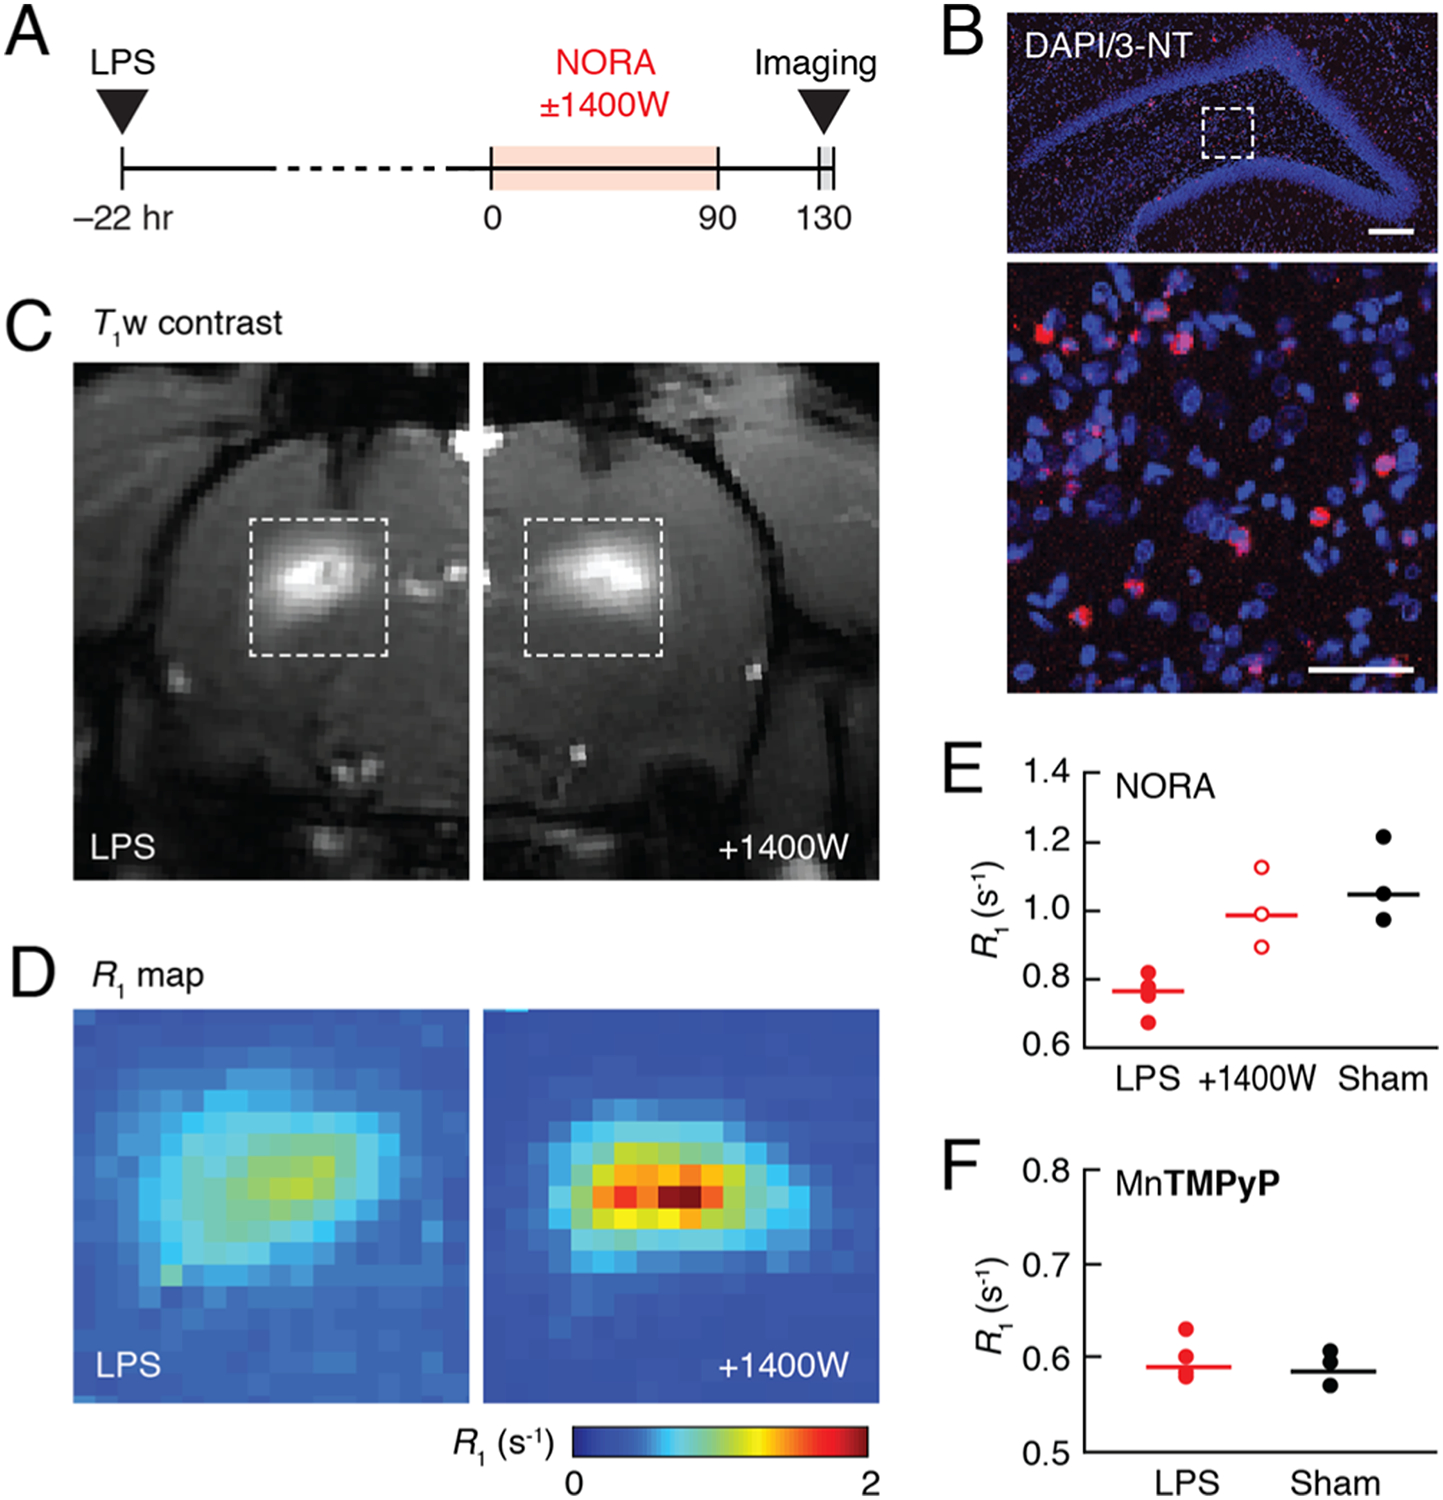
Figure 4.

Detection of NO production in a neuroinflammation model in rats. (A) Experimental timeline. (B) Coronal section of rat brain treated with LPS was stained with 3-nitrotyrosine (3-NT) and DAPI. The image at the top shows the hippocampal brain region where LPS was injected. The magnified view on the bottom corresponds to the boxed region at the top and reveals cells costained with anti-3-NT antibody (red) and nuclei (blue) stained with DAPI. Scale bars = 200 μm (top), 50 μm (bottom). (C) Representative T1-weighted images of rats treated with LPS and infused with NORA in the absence (left) or presence (right) of the iNOS inhibitor 1400 W. (D) R1 maps of LPS and NORA-treated regions corresponding to the boxes in (C), averaged over animals in groups without (left) or with (right) 1400 W treatment (n = 4 and n = 3, respectively). (E) Average R1 values observed in NORA-enhanced regions of rats treated with LPS alone, LPS and 1400 W, or sham surgery. (F) Average R1 values observed in rat brain regions enhanced with the control contrast agent MnTMPyP after either LPS or sham treatment. Dot plots indicate mean values (horizontal lines) and measurements from each subject (dots).
