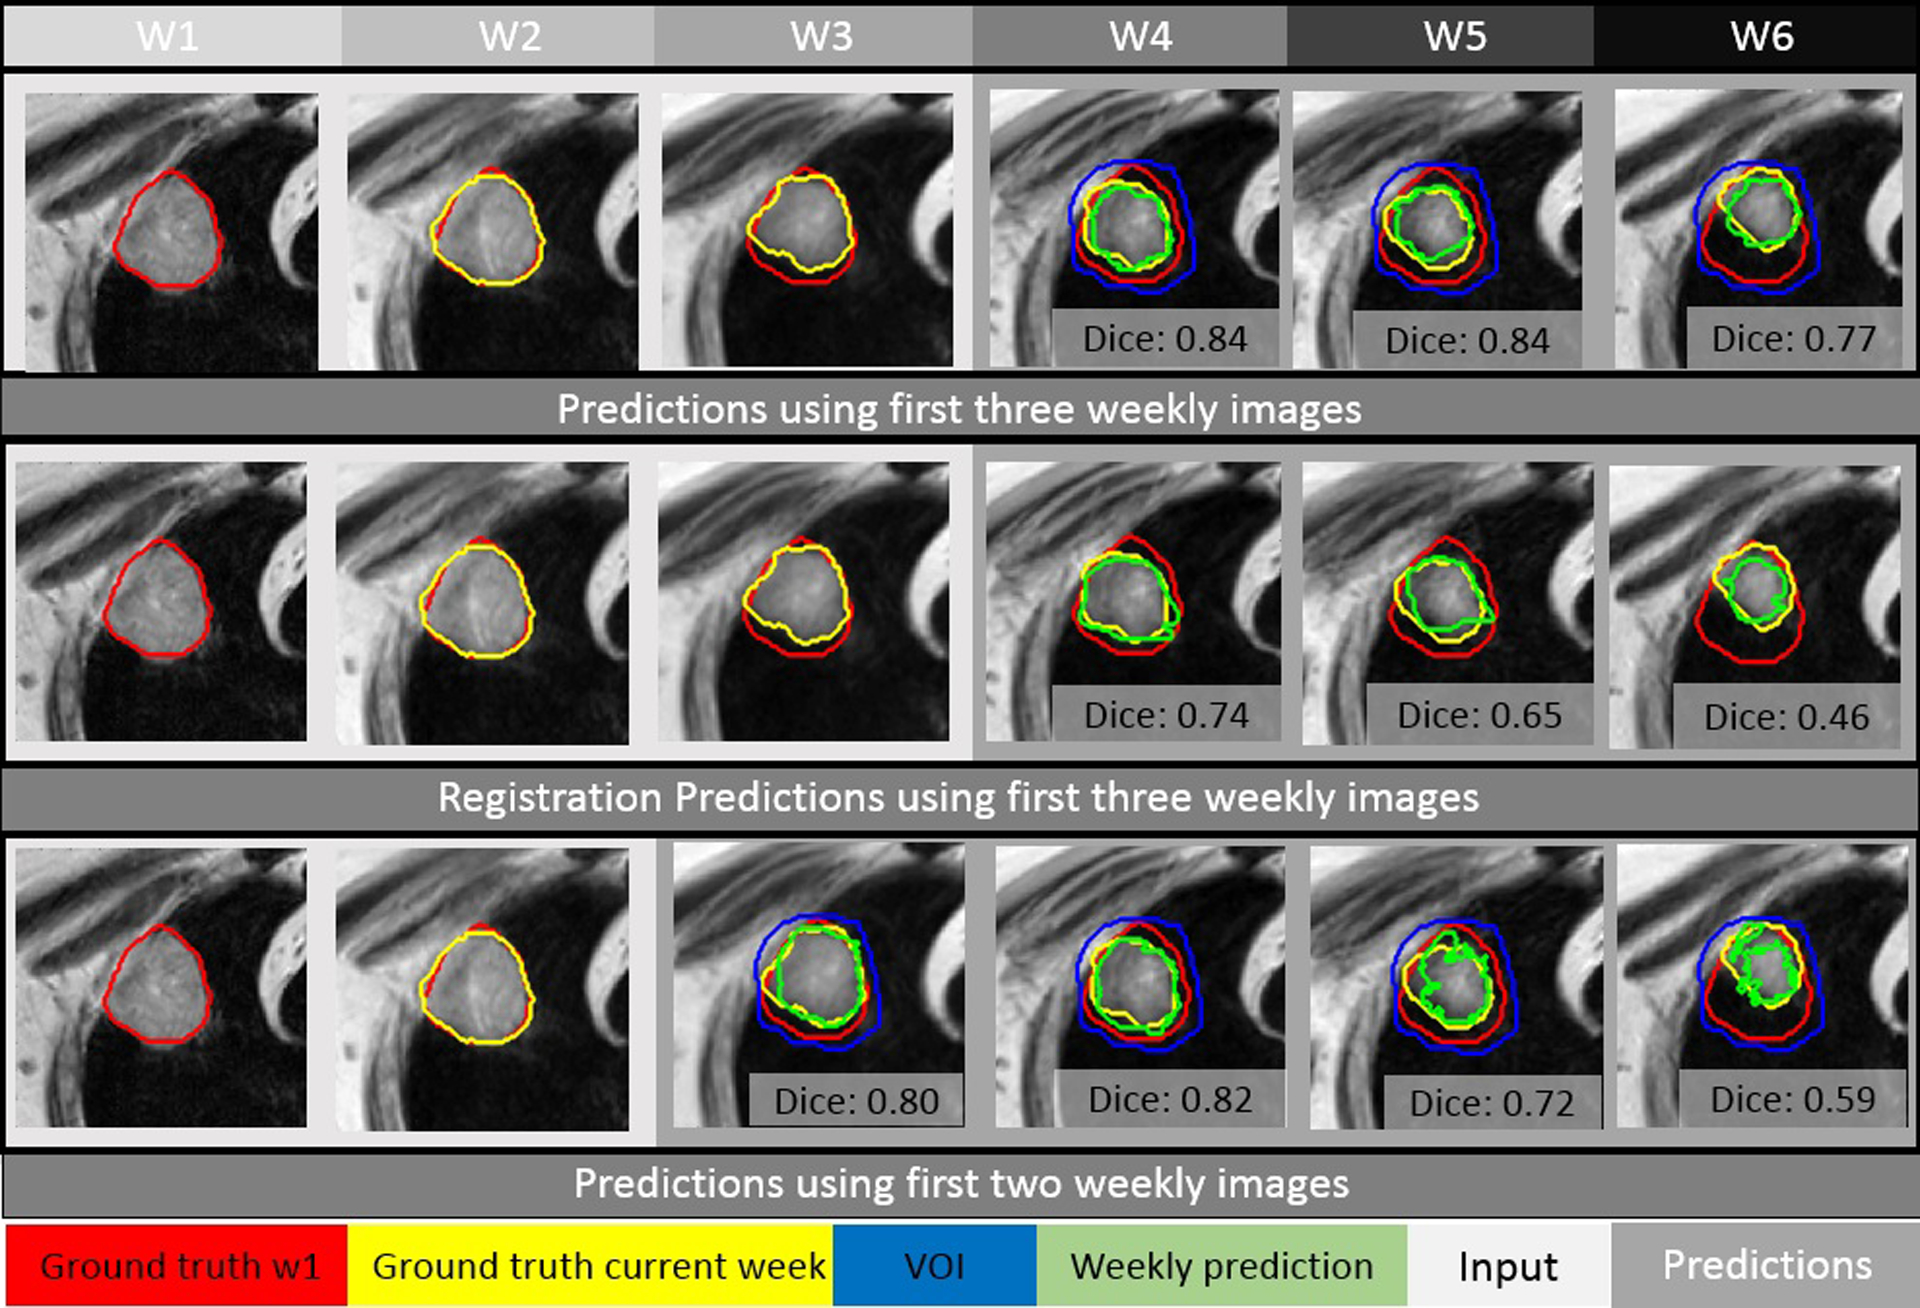
Figure 4.

Using the first two or three weekly MRI images as input (in the light gray box), predictions (images in the dark gray box) of tumor are made with P-net and deformable registration for patient #1. The initial week 1 contour, the actual tumor at a specific week, and the corresponding weekly prediction (via P-net or registration) are shown in red, yellow, and green, respectively.
