
Figure 1. ME-EPI data acquisition and processing.
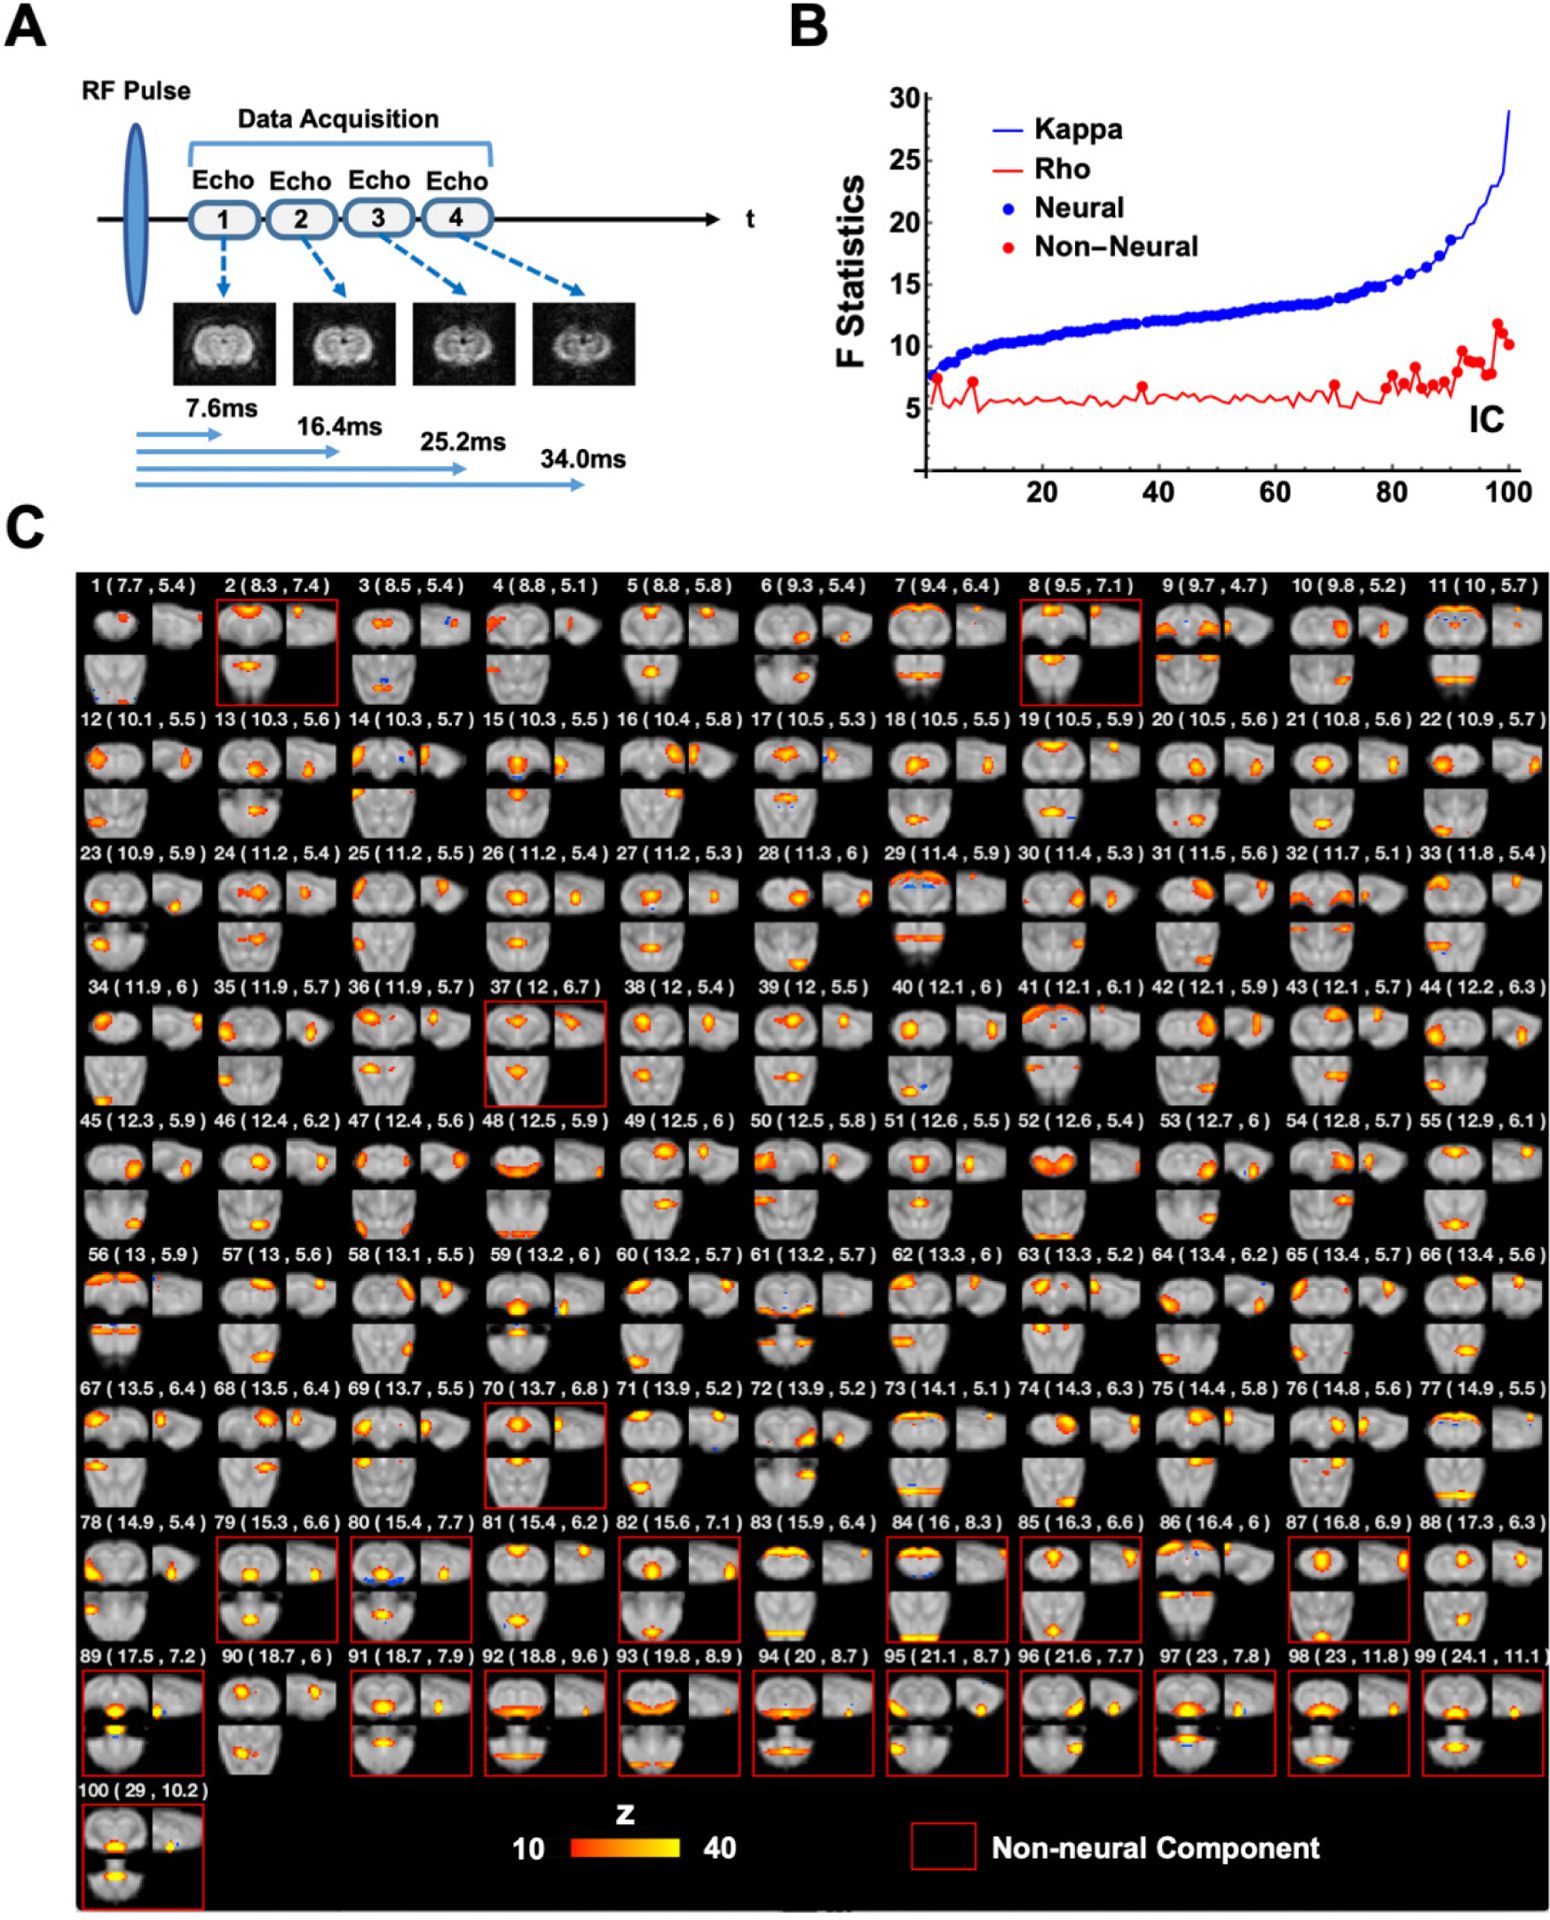
(A) Diagram of the ME-EPI pulse sequence. Four images were acquired per rsfMRI volume, each at a different TE. (B) BOLD (κ) or non-BOLD (ρ) weights of individual ICA components (blue and red lines), sorted by their κ values. 79 neural components (blue dots) and 21 non-neural (red dots) were identified. (C) Spatial map, as well as κ and ρ values (listed in brackets) for each individual component. Non-neural components were highlighted by red boxes.