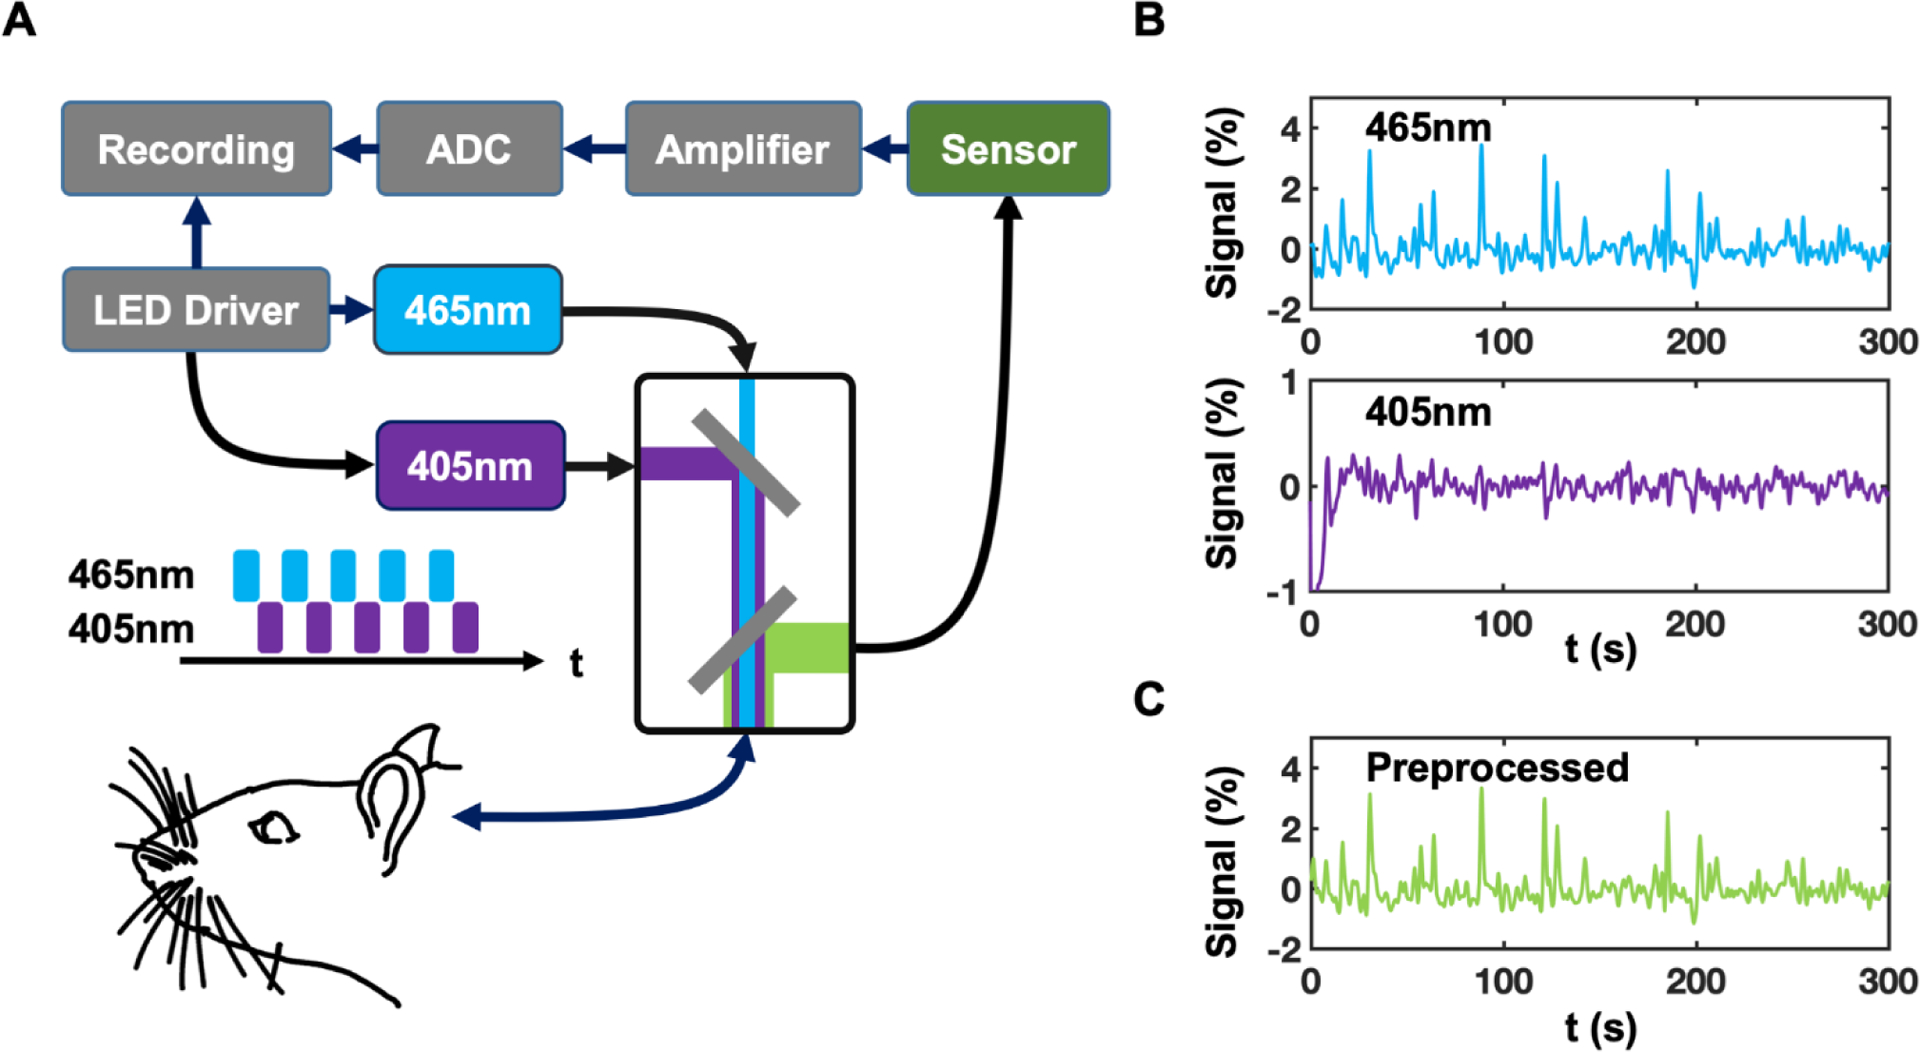
Figure 2. Setup of GCaMP fiber photometry and signal preprocessing.

(A) Setup of the two-wavelength GCaMP fiber photometry system. (B) Signals detected with 465 nm and 405 nm excitation wavelengths, respectively. (C) 405 nm signals were regressed out from 465 nm signals to provide fluorescence changes pertinent to neuronal activity.
