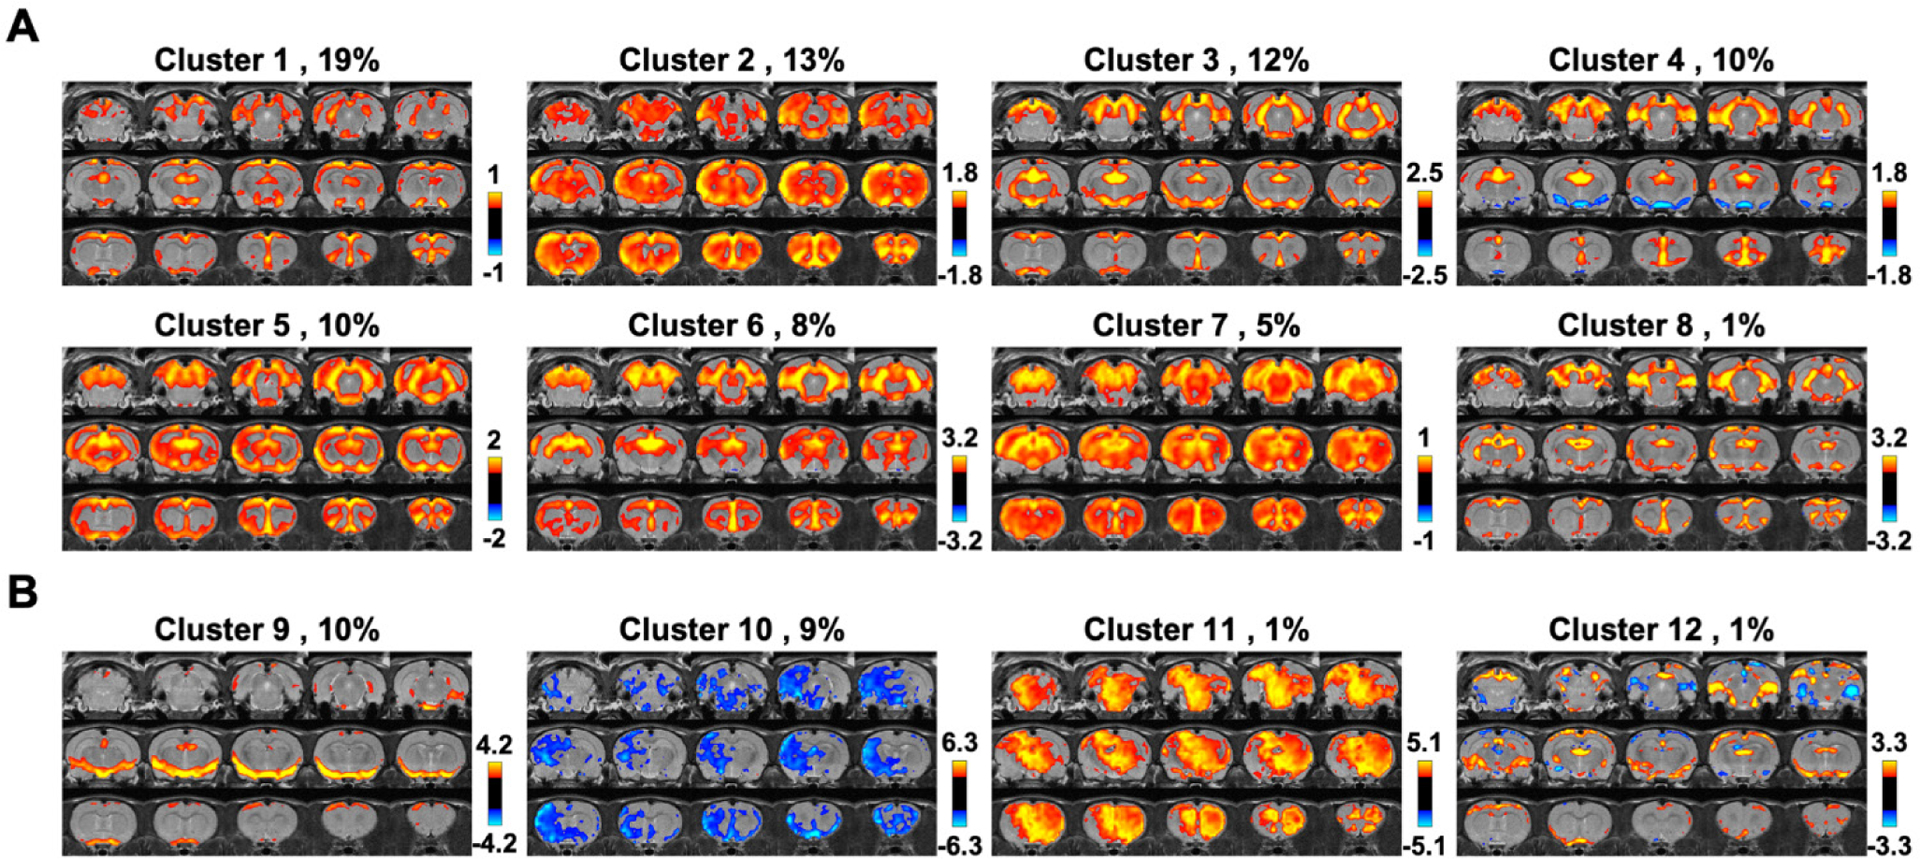
Figure 4. Clustering rsfMRI frames during global signal peaks.

(A) Clusters resembling the mean global signal CAP. (B) Clusters exhibiting distinct CAPs. The occurrence rate is displayed next to the cluster number.

(A) Clusters resembling the mean global signal CAP. (B) Clusters exhibiting distinct CAPs. The occurrence rate is displayed next to the cluster number.