
Figure 6. Spatiotemporal dynamics of the global signal.
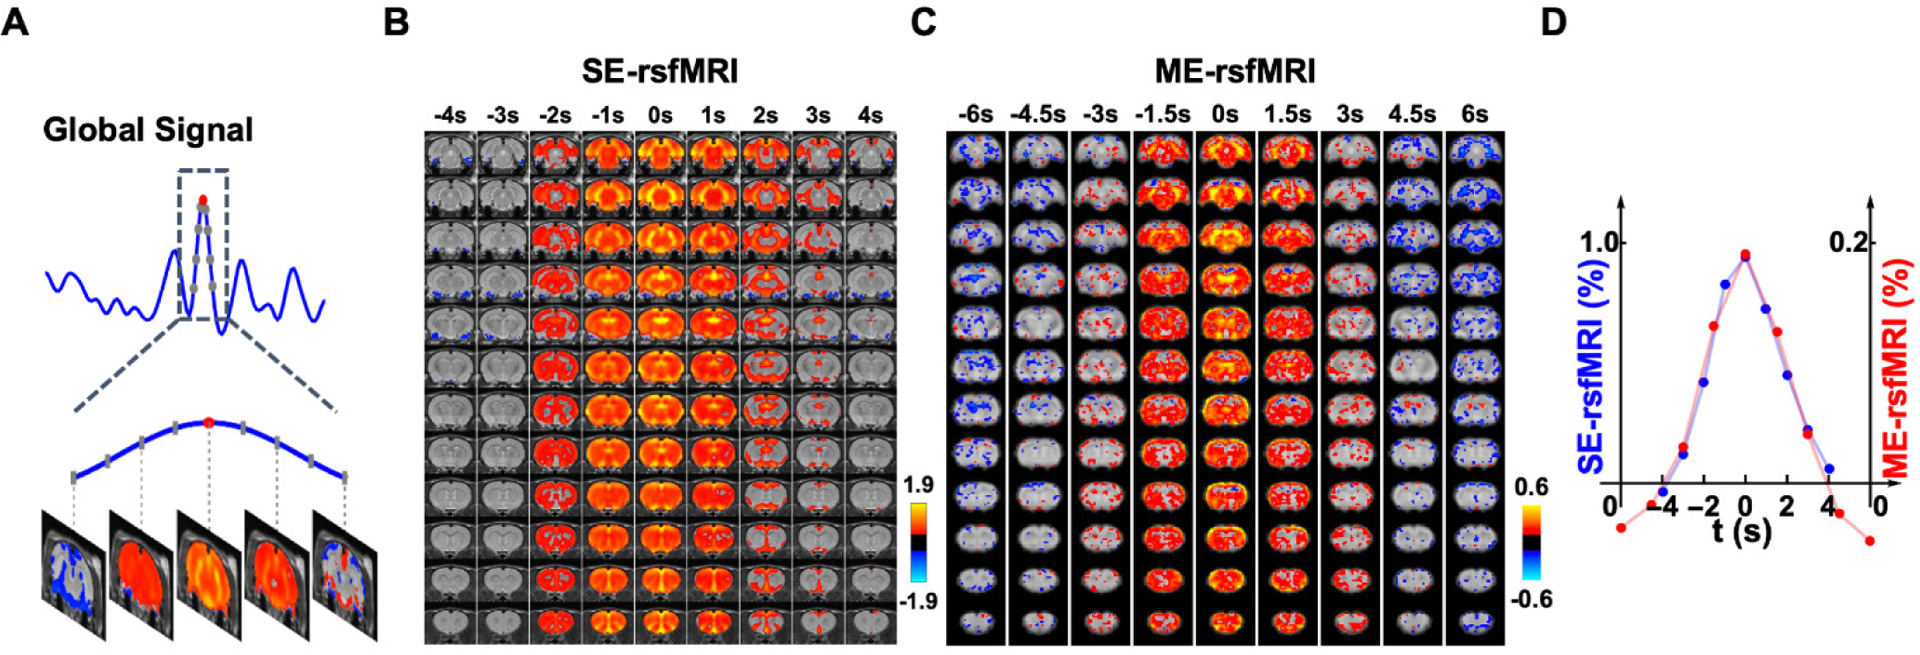
(A) An example of a global signal epoch including 8 rsfMRI volumes (gray dots) surrounding a local peak (red dot). (B) Averaged spatiotemporal pattern of global signal epochs in SE-rsfMRI data. Each column represents the averaged spatial pattern of global signal epochs at a time point. (C) Averaged spatiotemporal pattern of global signal epochs in ME-rsfMRI data. (D) Frame-by-frame global signal amplitude averaged across all epochs in SE and ME-rsfMRI data, respectively.