
Figure 5:
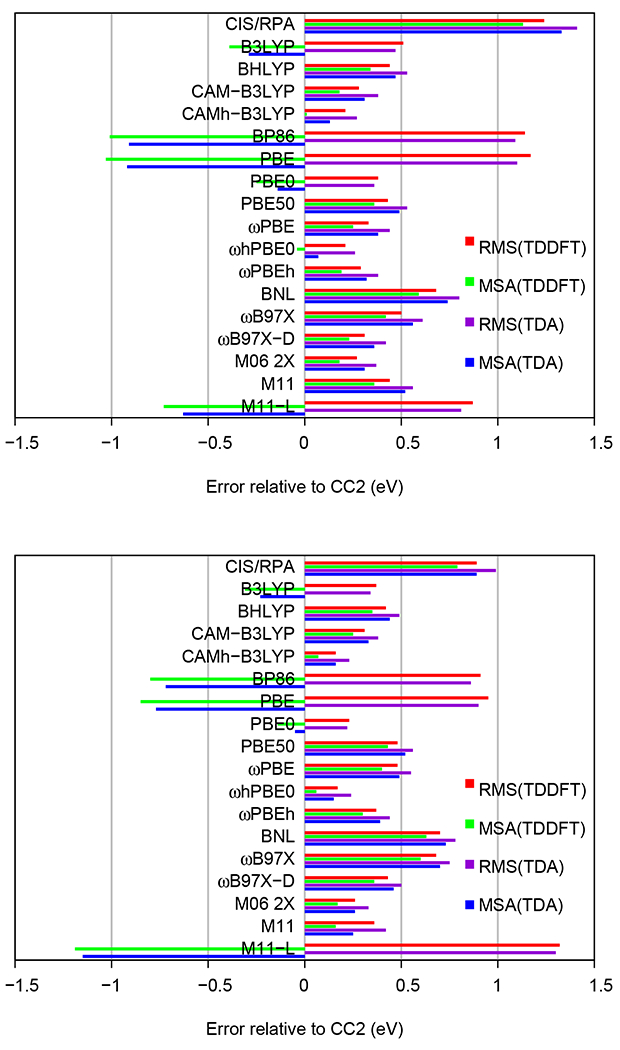
The root-mean-square (RMS) and mean signed average (MSA) differences (in eV) between VEEs calculated at the TDDFT, TDA and CC2 levels using the def2-TZVP basis sets (top panel) and aug-def2-TZVP basis sets (bottom panel). The excitation energies of the five lowest excited state of the 11 chromophores are included.