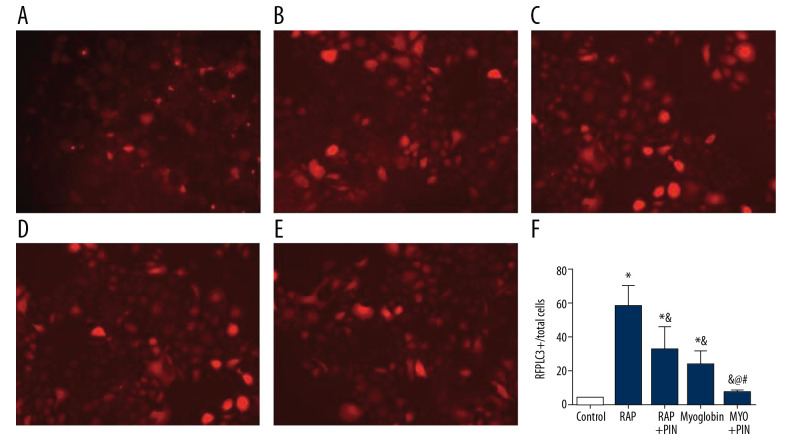
Figure 7.
Comparison of fluorescent spots of NRK-52E among different groups after LC3 double-labeled lentivirus infection. (A) Control; (B) Rapamycin; (C) Rapacymin+Pink1-siRNA; (D) Myoglobin; (E) Myoglobin+Pink1-siRNA. Compared with group 0, * P<0.05; compared with group 50, & P<0.05; compared with group 100, @ P<0.05; compared with group MYO, # P<0.05

