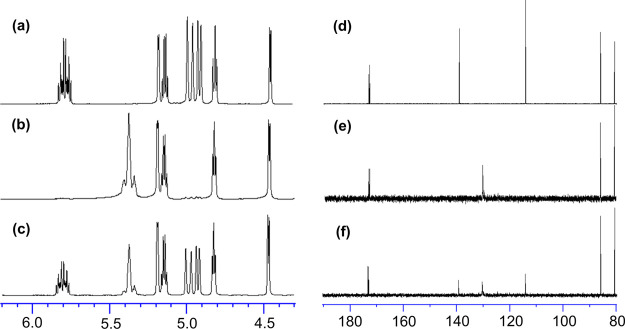
Figure 3.
1H NMR spectrum (in CDCl3 at 25 °C, expanded at 4.3–6.2 ppm) for (a) ME2 (monomer), (b) PE2 (ADMET polymer, run 15), and (c) DPE2 (after reaction with ethylene, run 49). The 13C{1H} NMR spectrum (in CDCl3 at 25 °C, expanded at 80–190 ppm) for (d) ME2 (monomer), (e) PE2 (ADMET polymer, run 15), and (f) DPE2 (after reaction with ethylene, run 49). The full spectra are shown in the Supporting Information (Figures S33–S35).a

