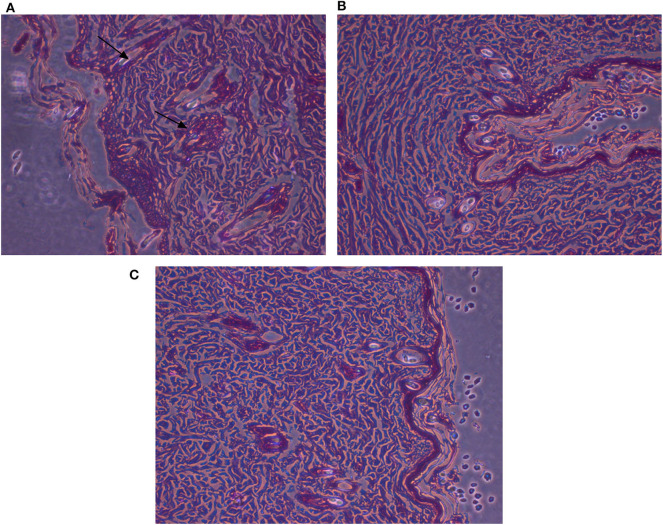
Figure 9.
Histopathological examinations of illustrative skin samples (stained with hematoxylin and eosin; ×40) after P. aeruginosa infections and upon AgNPs treatment: (A) P. aeruginosa infected group; (B) the non-infected group; (C) AgNPs -treated group. N = 3. All measurements were done in triplicate and the average was calculated ± standard deviation (SD) using GraphPad prism8 software.

