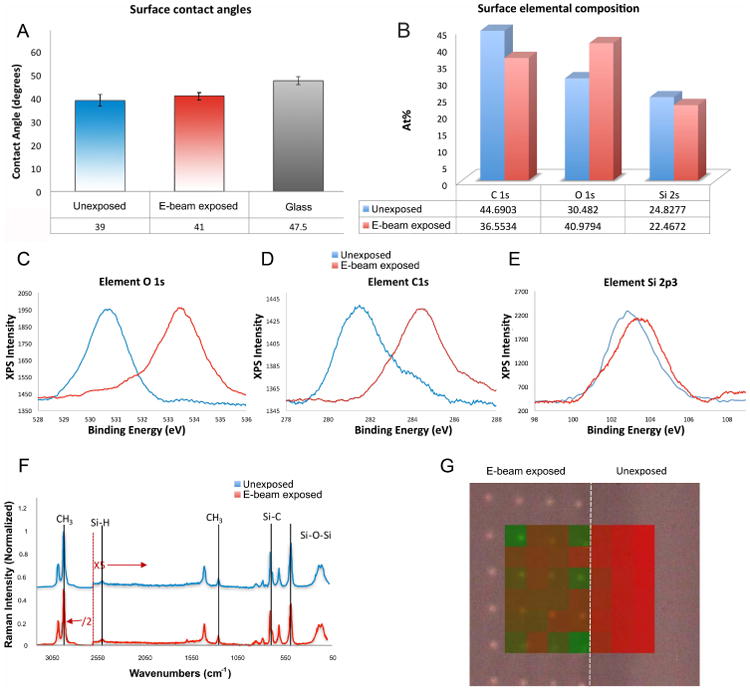
Figure 2. Chemical modulation of PDMS substrates by focused electron-beam patterning.

(A) Surface wettability analysis following PDMS treatment with an oxygen plasma. (B)High resolution X-ray photoelectron spectroscopy of (C) O 1s (D) C 1s and (E) Si 2p3. (F) Raman spectra of (F) Raman spectra of e-beam exposed and non-exposed PDMS regions. The spectra below 2600 cm-1 was enhanced five-fold, while spectra above 2600 cm-1 was reduced two-fold, for better visibility of the peaks. (G) Component Discriminant least squares analysis, using peaks from e-beam exposed (green) and unexposed (red), as the spectra of the components, shows spectral differences on PDMS patterned with 1μm spots. The figure shows that the peaks that define the control region are also found in the inter-spot region (red), while the e-beam exposed 1 μm spots are associated with significant peaks (green) that are not present in non-exposed regions.
