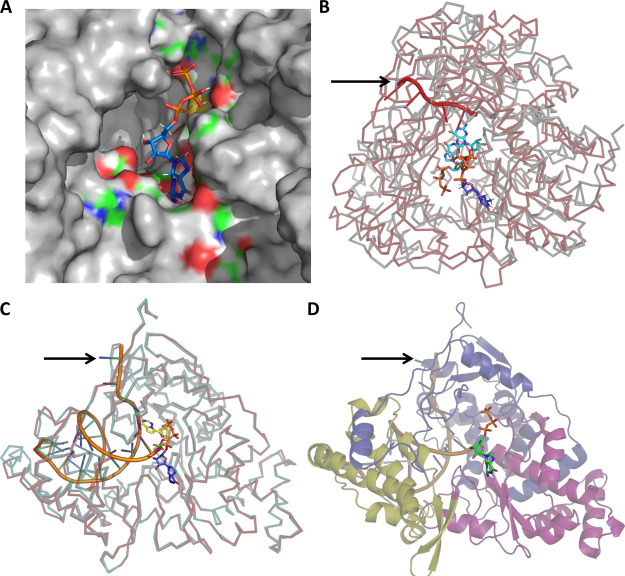
Figure 2.
Predictions of the GTP binding site and initiation complex for CoV2-RdRp. (A) Zoomed-in view of the energy-minimized conformation of GTP bound to the predicted binding site (blue indicates positively charged regions, red indicates negatively charged regions, green indicates neutral regions, and gray indicates regions beyond the GTP binding pocket). (B) Superimposition of GTP-bound CoV2-RdRP and the GTP- and RNA-bound Pseudomonas phage φ6-RdRp reveals the conservation of the GTP binding pocket and its close proximity to the template RNA. (GTP bound to CoV2-RdRP and Pseudomonas phage φ6-RdRp in blue and cyan, respectively, CoV2-RdRP ribbon in gray, Pseudomonas phage φ6-RdRp in red, and RNA indicated with a black arrow.) (C). Superimposition of the GTP- and RNA template-bound CoV2-RdRP model and the RNA- and remdesivir (monophosphate)-bound CoV2-RdRP (PDB ID: 7BV2) reveals proximity of the GTP binding pocket to the primer RNA (model CoV2-RdRp in cyan, cryo-EM-determined CoV2-RdRp in red, RNA indicated with a black arrow, GTP in deep blue and orange (phosphate) sticks, and remdesivir in yellow and green (phosphate) sticks). (D) Predicted model of the CoV2-RdRp initiation complex generated following comparison with the cryo-EM-determined RNA-bound CoV2-RdRP, depicting the GTP and RNA molecules (GTP in green and orange sticks and RNA indicated with a black arrow).

