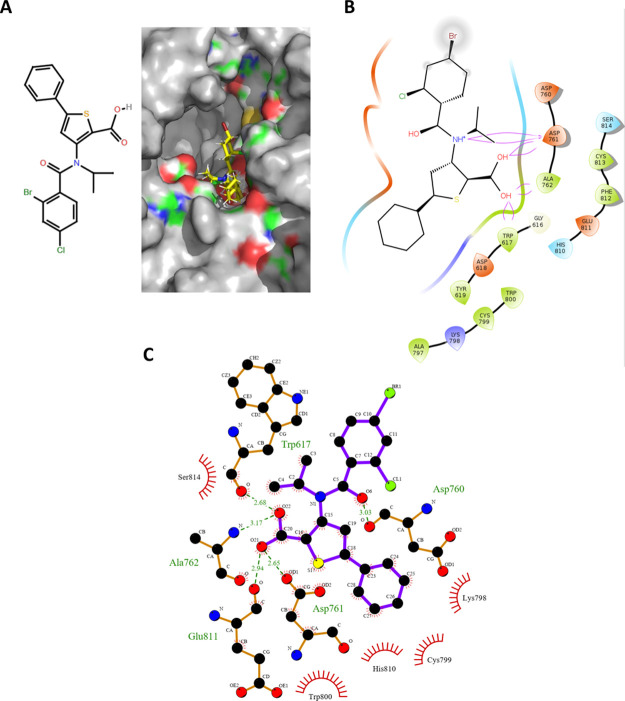
Figure 4.
Molecular docking of the lead-optimized molecule onto the predicted GTP site and its molecular interactions with the RdRp amino acid residues. (A) Computationally directed binding of the lead-optimized molecule (2D structure in the left panel) at the GTP binding sites (right panel) (blue indicates positively charged regions, red indicates negatively charged regions, green indicates neutral regions, and gray indicates regions beyond the GTP binding pocket). (B) Molecular interactions of the lead optimized molecule with the amino acid residues at the GTP binding sites. (C) Detailed view of the interactions between the amino acid residues lining the GTP binding pocket and the lead optimized molecule (please refer figure for details of the representation format).

